Contents
How to set up your Pipeline Looker Studio GA4 Sessions Template
So you’ve got your data loaded into Pipeline - GA4. Good job.
The next step is creating your first Looker Studio dashboard. Well, luckily for you, we have a GA4 sessions Looker Studio dashboard template which you can easy copy.
This is built off a single data source, the GA4 Pipeline sessions table.
What does the GA4 Pipeline Sessions template do?
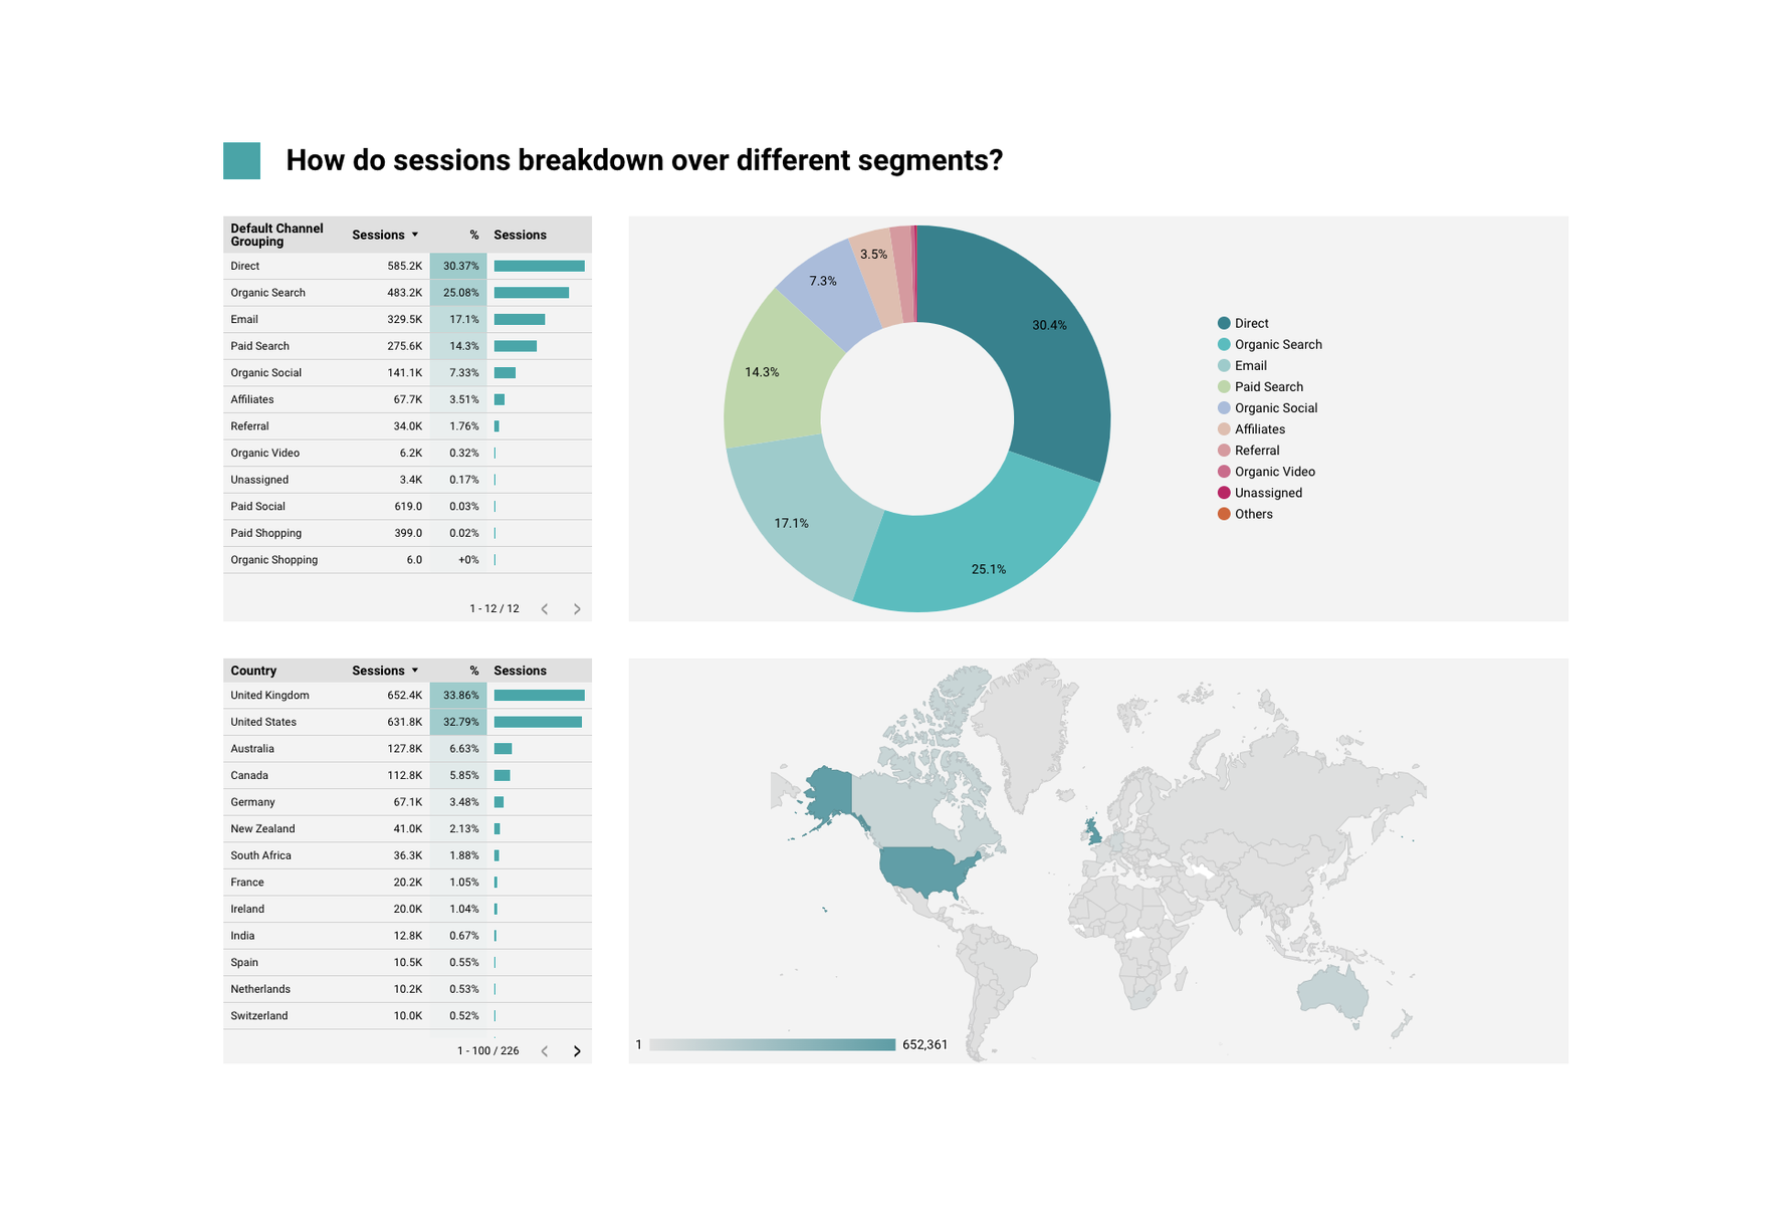
The dashboard is a single page dashboard built of a single data source - the Pipeline GA4 Sessions table.
This contains:
- Scorecards summarising performance compared to the previous period & year.
- How the sessions are broken down by different session mediums.
- Session breakdowns over different segments such as:
- Default Channel Grouping
- Country
- Day of the week
- An interactive comparison of how different metrics compare over time.
- An interactive comparison of how different metrics look broken down over different dimensions.
- The top performing pages by sessions.
How to make the GA4 Pipeline Sessions dashboard.
This can be broken down into 4 steps:
- Get your GA4 data running through Pipeline GA4.
- Create your Pipeline GA4 Sessions table as a data source.
- Make a copy of the Looker Studio template.
- Connect your Sessions table as the data source.
1. Get your GA4 data running through Pipeline GA4.
We assume you’ve already done this - or why would you be looking at this blog?
But if not, you can visit the documentation for Pipeline and follow the steps there.
This will mean your processed GA4 data will be loaded into different tables in BigQuery.
The different out tables produced are:
| Table Name | Type | Default or Optional | What does it do? |
|---|---|---|---|
ga4_mrt_clients | output | Default | Client level data (i.e. device + browser) |
ga4_mrt_items | output | Default | Ecommerce item level data |
ga4_mrt_pages_daily | output | Default | Page level data (daily) |
ga4_mrt_pages_hourly | output | Default | Page level data (hourly) |
ga4_mrt_sessions | output | Default | Session level data. |
ga4_mrt_attribution | output | Optional | Attribution models for conversions |
ga4_mrt_users | output | Optional | User level data. (optional) |
For this we’ll be using the ga4_mrt_sessions table as we’ll just be looking at sessions.
2. You will need to create your Pipeline GA4 Sessions table first
The first step is going to this link.
This link allows you to create a dataset, in this case the GA4 sessions table.
Let’s break this down:
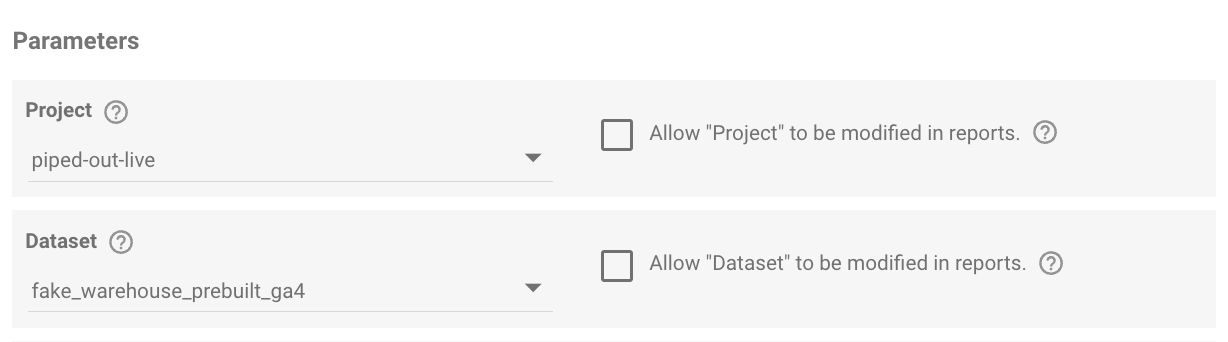
- Select your BigQuery project.
This will will then show you the dataset for any pipelines you have setup.
- Select the Table
For this, you will want to select Sessions.

- You will then need to select Primary Schema.
There is only one option - and you need to select it (or the Connector will not work).
This is a bit of a quirk of how Looker Studio Connectors & BigQuery interact.

- Select the Time Period.
You can select single period.

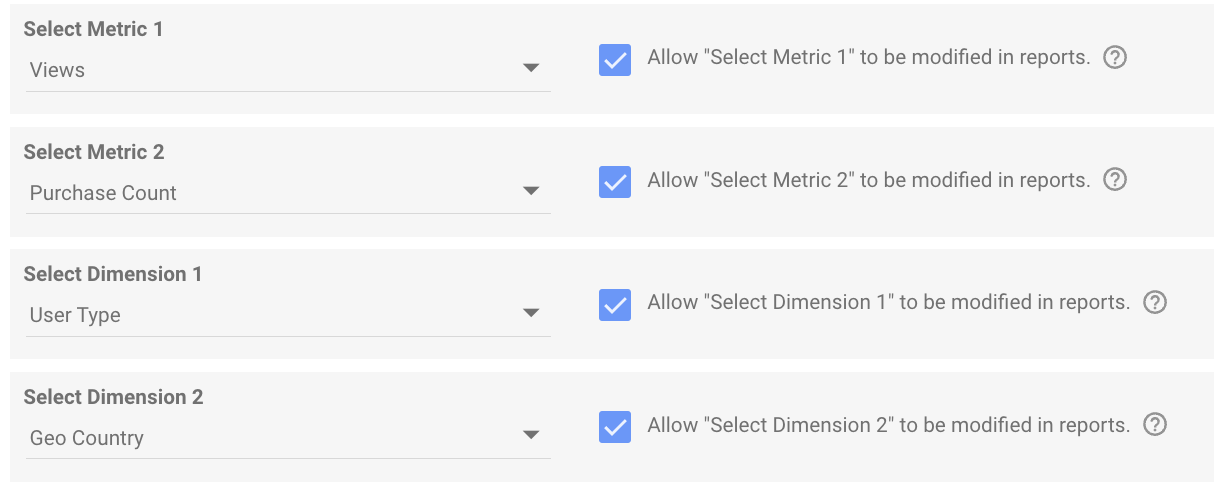
- Select the Metrics & Dimension Parameters
For this you can select the the most common metrics and dimensions you use.
These will be the defaults when viewing data in your dashboard.
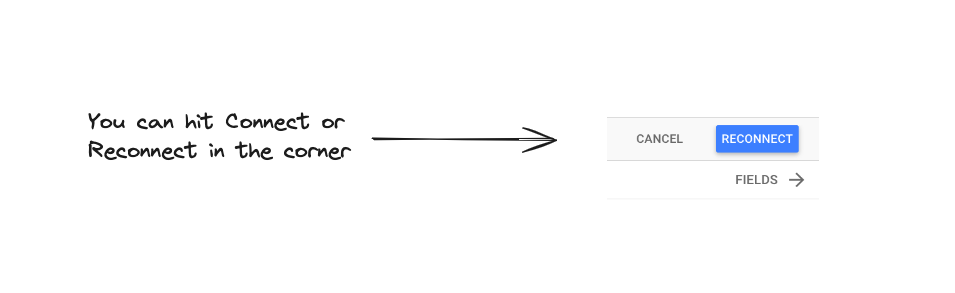
- From then you will be able to Connect or “Reconnect” in the top right hand corner.
So at this point, you now have your GA4 sessions table.
3. Make a copy of the Looker Studio template.
This is broken up into several stages:
- The first step is visiting the single page sessions dashboard template.
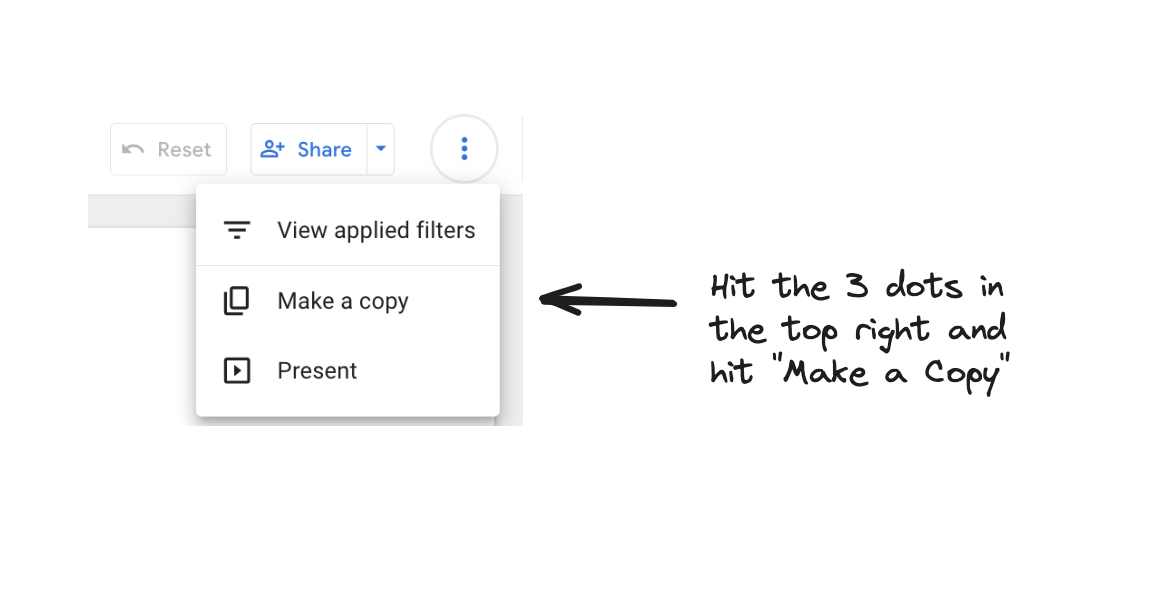
- You’ll then want to go to the three dots in the top right > Make a copy
4. Connect your Sessions table as the data source.
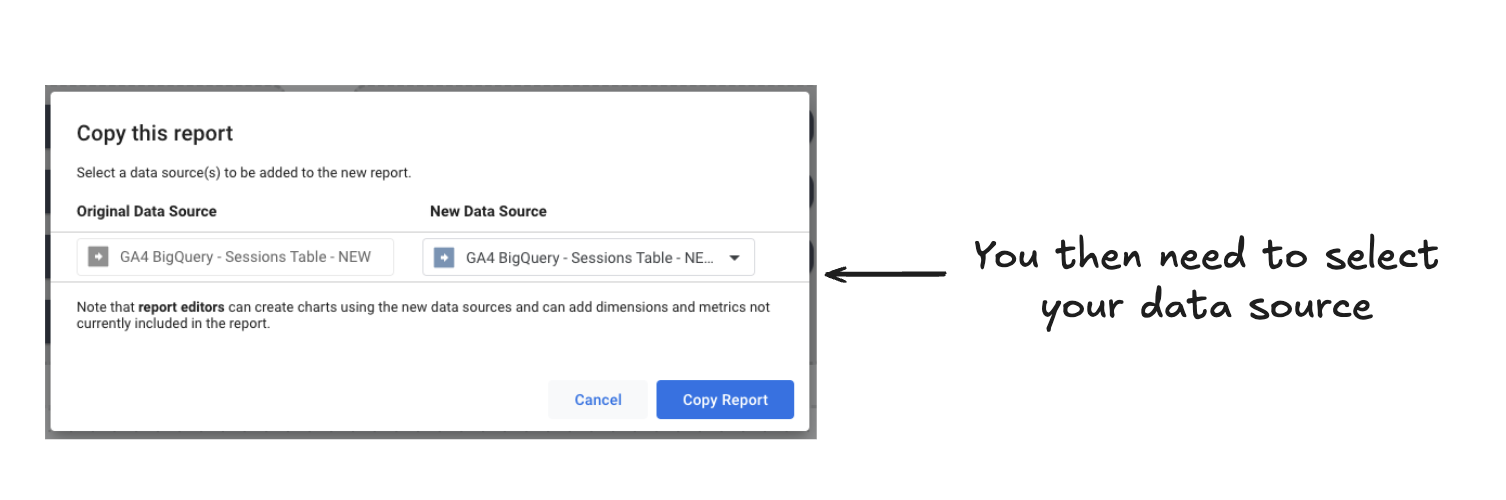
The next option which automatically appears is which data source you want to connect to.
For this dashboard that will be your sessions table.
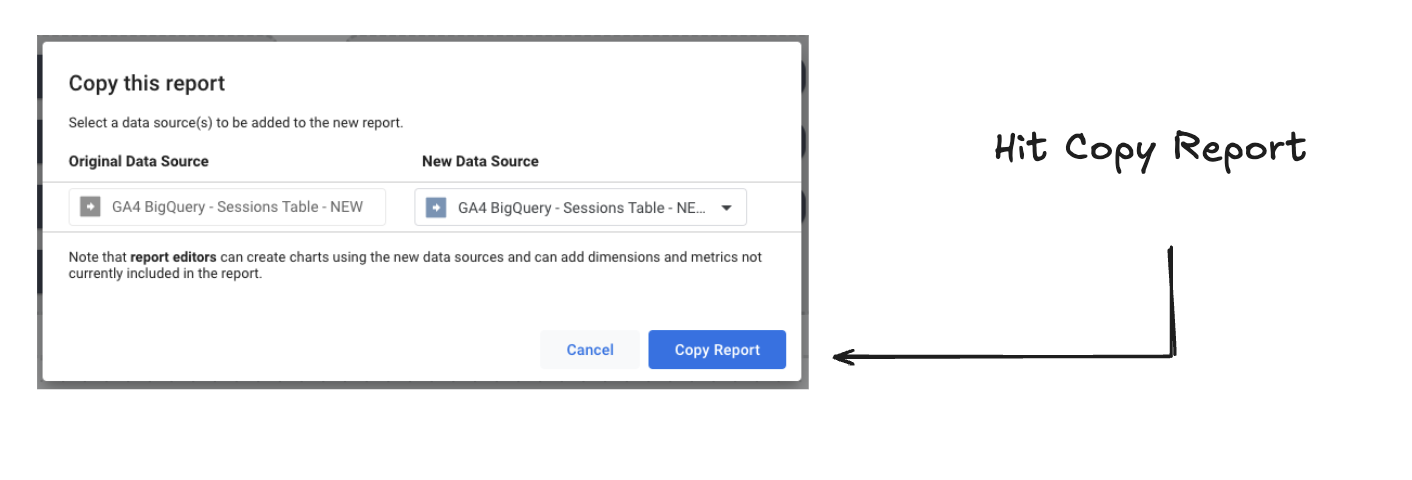
5. When you’re done hit copy report.
Then hey, you have your template.
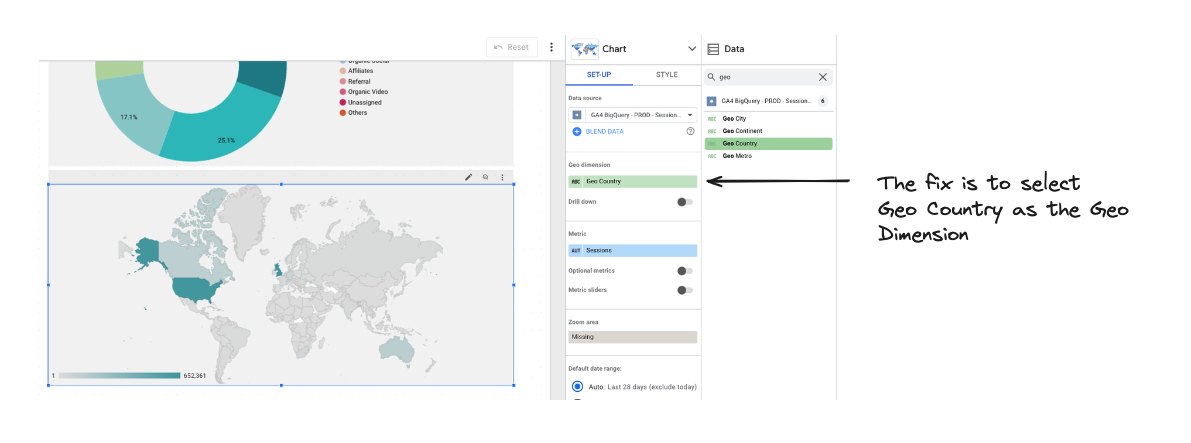
When making a copy of a Looker Studio template, even through the data sources contain the same fields, they can occasionally still throw errors.
A fairly consistent one is the Country, Geographical map.
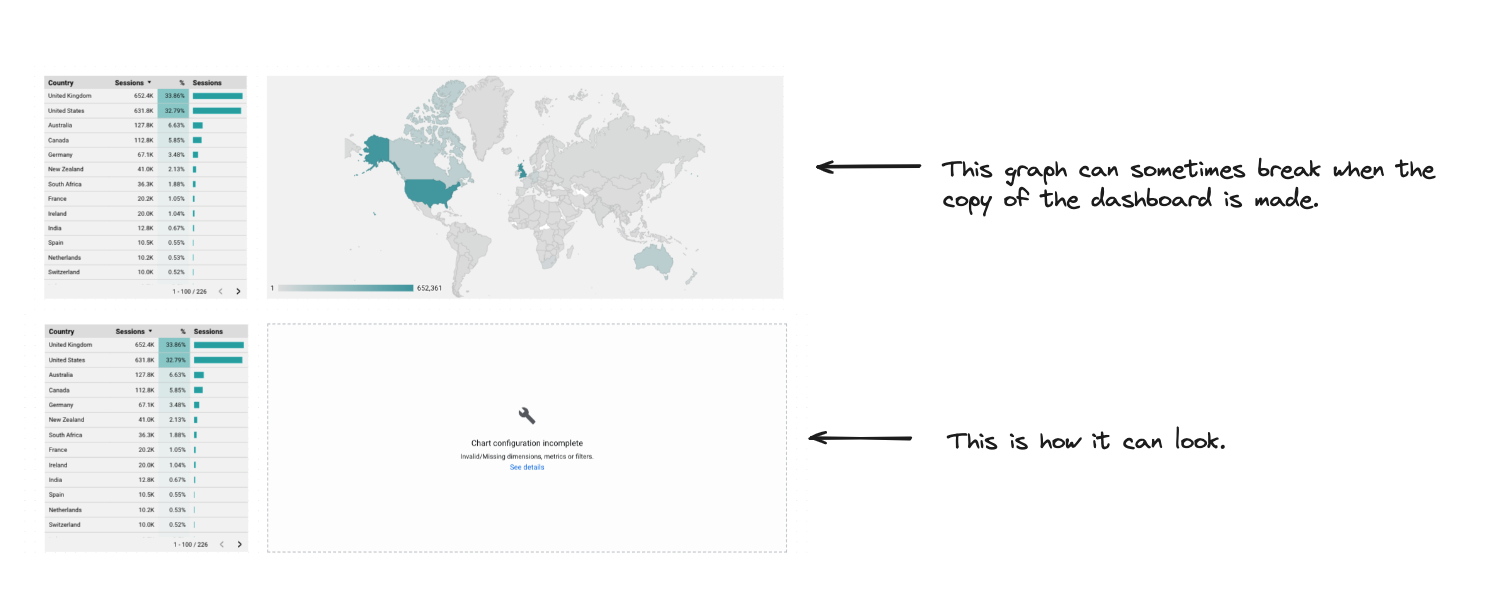
Though, there is a pretty simple fix.