Using the Looker Studio Connector
The Looker Studio Connector is the easiest way to access your Pipeline BigQuery GA4 data.
If you've come here from Looker Studio directly and don't know what Pipeline is, you'll probably want to start here:
But a quick reminder it only works with GA4 BigQuery data processed through Pipeline.
If you already know all that and want to signup/login you can do it here, where you'll also find our terms, privacy policy and all the legalese.
Where does the data from the Pipeline GA4 Connector come from?
All the data comes from the tables we build in the pipeline.
The Looker Studio Connector is doing two things:
- It takes the data from the pre-processed tables.
- It adds some formulas to calculate metrics that can only be calculated in a BI tool.
How do I use it?
Let’s break this down step by step.
Firstly - you will need to have set up your Pipeline.
If you’ve not done that, head to this section to start creating your Pipeline.
1. Create a data source in Looker Studio
First step is creating a data source in Looker Studio.
You can use this link to create a data source: Pipeline Looker Studio Conenctor
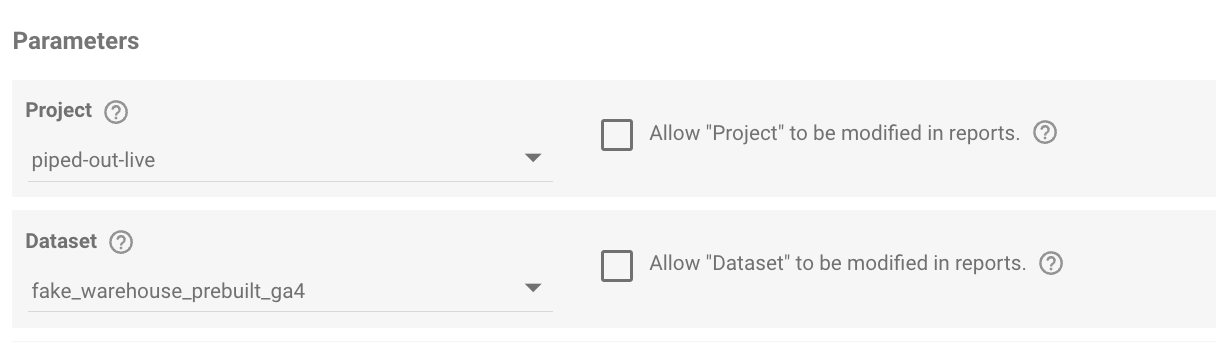
2. Select your Dataset & Project
Select your BigQuery project.
This will will then show you the dataset for any pipelines you have setup.
It will only show datasets where the full GA4 set-up has been completed. If you’re missing a dataset and you’ve completed the run please contact support.
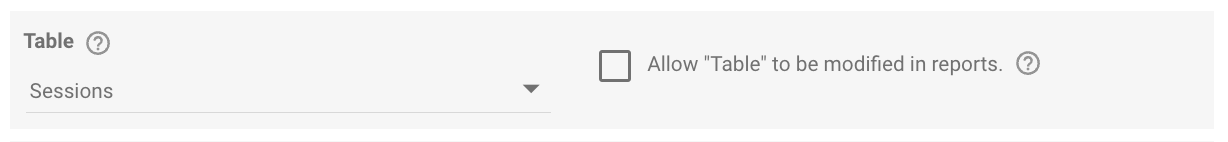
3. Select the Table
You will then have the option to select which table you want to produce.
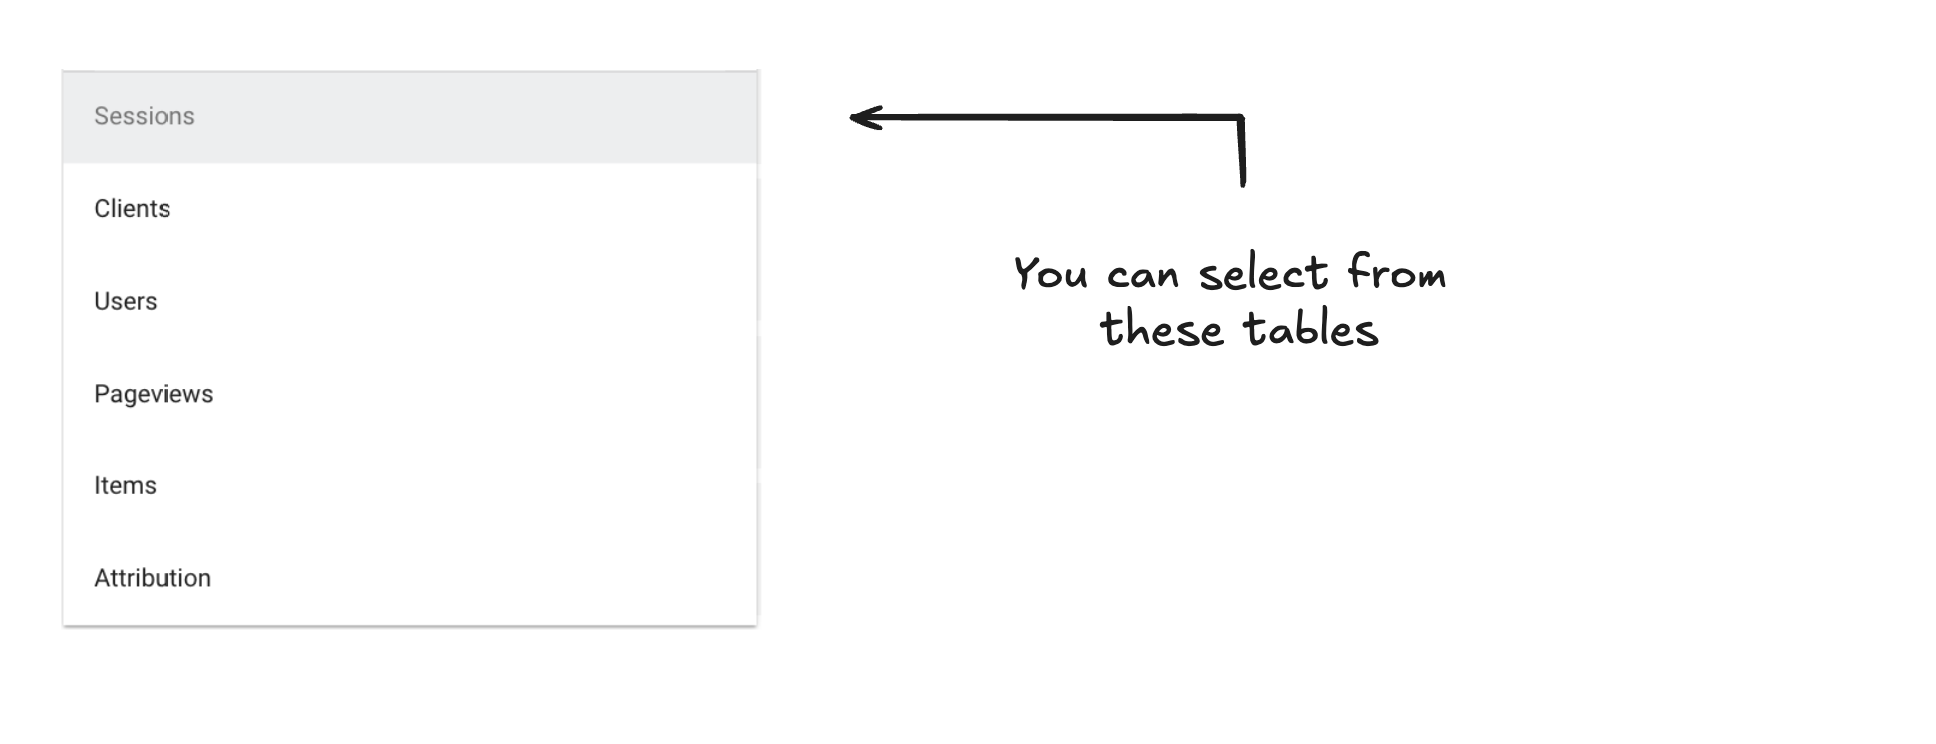
How do I know which table to pick?
Pick the scope you want to work at.
Do you want to know:
- Where do your users come from? > User Scope
- Where do your sessions come from > Session Scope
- Which page gets the most visits from a country > Hit scope
Important Note: Not all metrics are compatible with all dimensions.
We discuss this more on the GA4 scoping page.
This will be restricted to those that actually exist.
If you do not have User ID set up, then the Users table will not be available.
Note: If you change table when you edit this you might need to reselect it.
For more about the different tables, see this section.
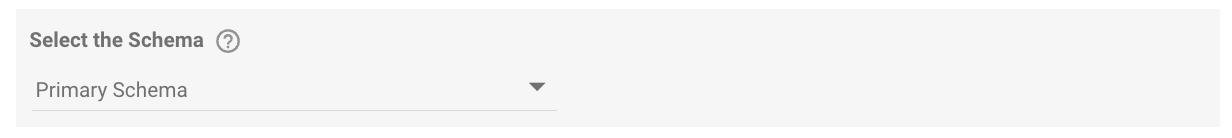
You will then need to select Primary Schema.
There is only one option - and you need to select it (or the Connector will not work).
This is a bit of a quirk of how Looker Studio Connectors & BigQuery interact.
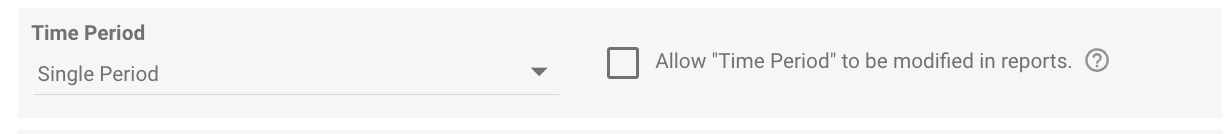
Select the Time Period
You can select single period. Pick this 90% of the time.
You’ll be able to create graphs and use the default Looker Studio period comparison.
If you want access to the individual period comparison fields so you can do more complex % calculations you’ll need to use period comparison.
[Optional] Select the Metrics & Dimension Parameters
This is optional.
If you are accessing the Looker Studio dashboard for the first time, you can skip this and when you’re familiar with the data, you can come back to this.
These parameters are linked to dimensions which can be used in graphs and tables.
Important note: You will need to tick the checkboxes for these metrics & dimensions if you want to use the Looker Studio Templates.
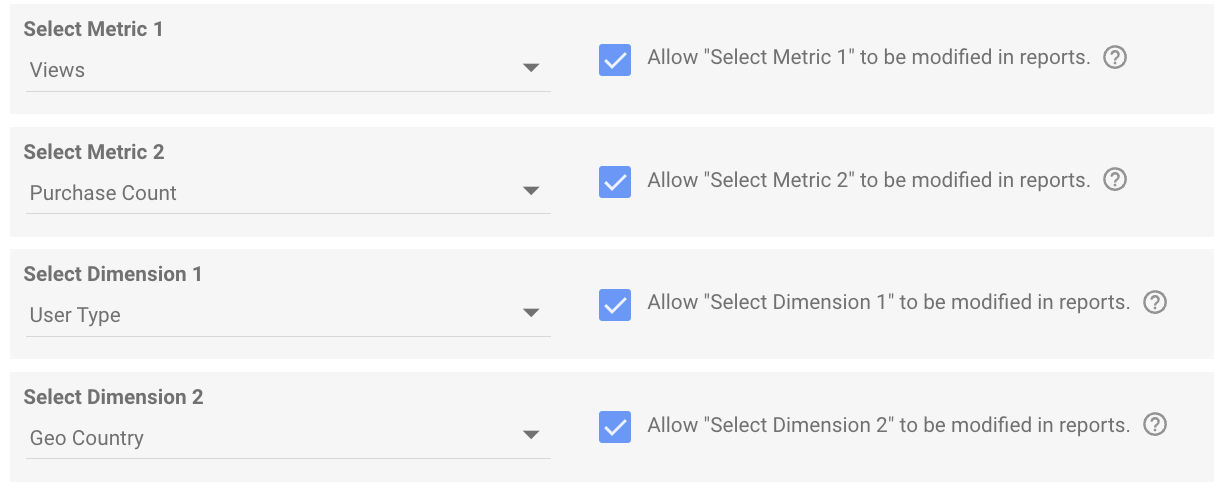
Select the Optional Metrics & Dimension Parameters
From then you will be able to Connect or “Reconnect” in the top right hand corner.

Using the Looker Studio Connector
You’ve set up your Looker Studio Connector. Let’s start using it.
There are a couple of things to bear in mind when in the Looker Studio interface.
Date Range Dimensions
You’ll see a number of different date range dimensions.
Where Looker Studio asks for a date field (e.g. in a Time Series Graph), you should use “Date.”
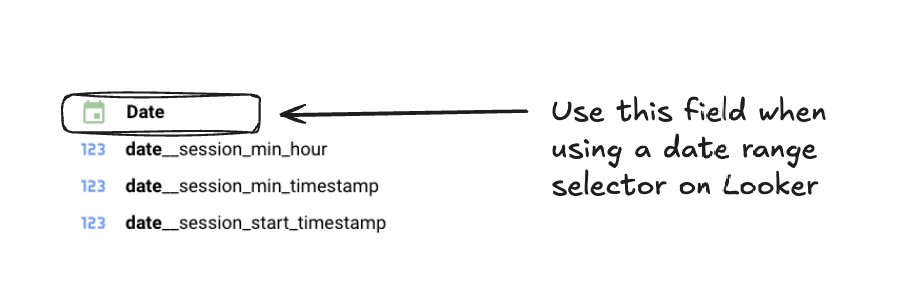
The others do more specific things and should be used just as dimensions.
There are additional fields in Looker Studio that are not in BigQuery
Some fields can only be calculated at the final stage of data visualisation.
This is because filters or aggregations can change these numbers and cause unexpected results.
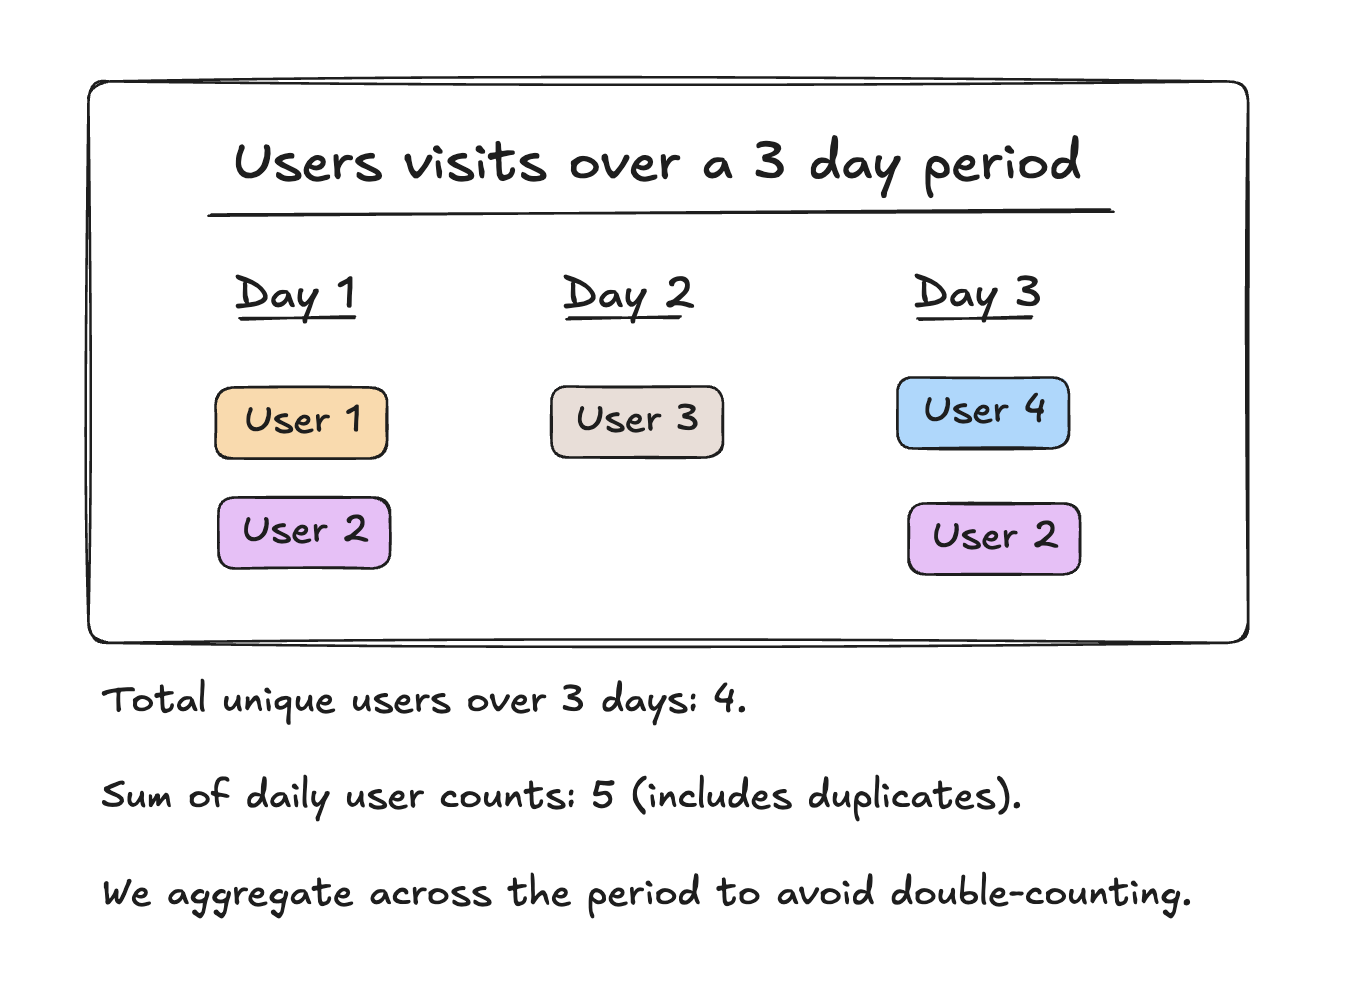
Example: Let’s say that we’re filtering to the number of users over a 3 day period.
The user table contains a single row per user.
You have to look over the whole of that 3 day period and count the number of unique users.
If you tried counting the number of users per day and adding that up, you’d be double counting a lot of users.
As a result, some fields are only available through the Looker Studio connector.
This includes:
- Users Counts in the Client Table
- Sessions Count in the Session Table.
- Conversions rates and Average Order Value for eCommerce.
See the below example.
The beady eyed of you may notice that there are actually two potential "users":
- Pseudo Users / Non-logged In Users
- User ID / Logged in Users
Within the documentation, we refer to these as:
- Non logged users: Clients
- Logged in Users: User IDs
Both of these are described in the GA4 interface as users.
So how do I know whether we’re referring to Clients or User IDs across the different tables?
By default, we use Clients as users across all tables by default except the User ID table.
If you’ve setup User IDs then they are your users in the User ID table.
If you want to set up User ID as users across the other tables, then you will need to add in/update your own custom fields.
To see the formulas for users, see the field names for the different tables.
These can be found here:
Let’s start with Clients…
Clients aren't actual users, but are unique device-browser pairings which are used to act as a proxy for users. This is your default “Users.”
So, if someone visits your site from their phone and later from their laptop, that counts as two different "Users," even though it’s the same person behind both devices.
So what about User IDs?
User ID offers a more accurate way to track individual users.
An ID is assigned to each user, usually through a login, and follows their activity across numerous sessions, devices, and browsers.
So if a logged in user accessed the site on their laptop in the morning and then on their phone in the afternoon, this is one single user_id.