How to merge GA4 & UA in Looker Studio?
You can blend GA4 and UA together in Looker Studio. But you do need to be careful (and get ready for mid July).
Let’s walk through how to do it and what to watch out for it.
This post can broadly be broken down into:
- Why do it?
- What to watch out for when comparing the numbers.
- How to actually do it.
- Why the Looker Studio connector will break halfway through this year and what we can do about it.
Here's a quick table of contents.
Are you a video person?
Great! We have a video version of this blog post for you.
Why join GA4 and UA?
- Year on year reporting
- A baseline for forecasting when you have “strange” years (looking at you 2020 & 2021).
- You’ll find some analytics bugs, fix them and have more accurate tracking.
You might not find bugs, but almost everyone we worked with did when doing this process.
Problems with comparing GA4 & UA
The first thing you might hear on discussing this is:
- GA4 and UA aren’t the same, You can’t compare them.
Our hypothetical commentator isn’t wrong, they’re not identical, but that doesn’t mean they can’t be usefully compared as long as you’re aware of the differences.
What are the differences between GA4 and UA?
This was a bit too long to fit into this blog post, so we’ve made a separate one to cover the differences between how UA and GA4 measure. Go have a read then come back filled with the satisfaction of knowing what’s up.
If you don’t care about the why and just the practicalities then read on.
What does that difference look like in terms of numbers?
To pull out the most relevant point for reporting from the previous post (with no context):
How different are sessions between UA and GA4?
- Between 4 - 15%. Typically this was UA higher, but there were scenarios where this didn’t happen.
How different are pageviews between UA and GA4?
- Between 3-8% in either direction.
How different are revenue/leads between UA and GA4?
- Between 1-5% in either direction.
Did that change over time?
We found the traffic difference stayed consistent over time.
How did that breakdown by dimensions?
We found the relative breakdown of the traffic was also very similar.
i.e. if 30% of your traffic was organic in UA then 30% of your traffic was organic in GA4.
All of this only applied once GA4 was setup correctly
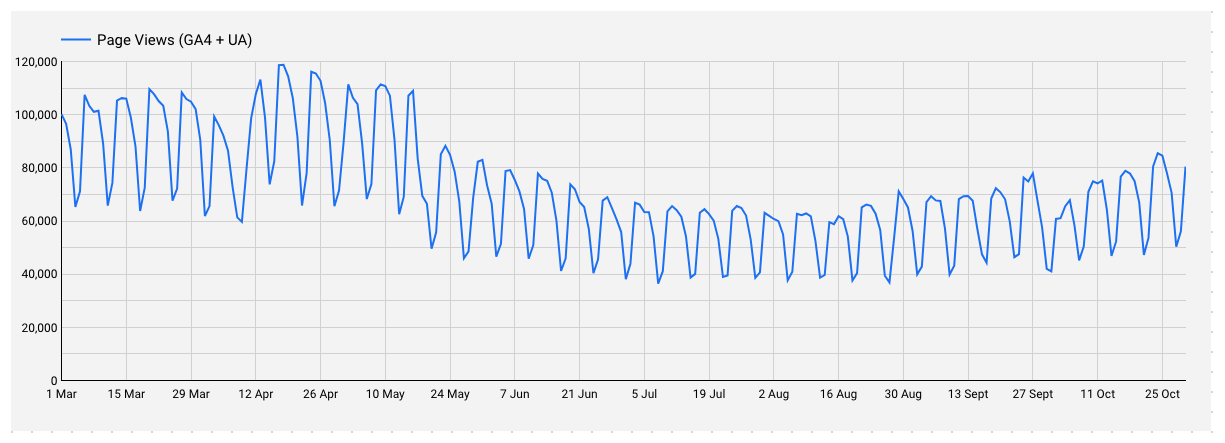
Take this example (enjoyably you’ll note the data got fixed on the 1st of July 🙂):
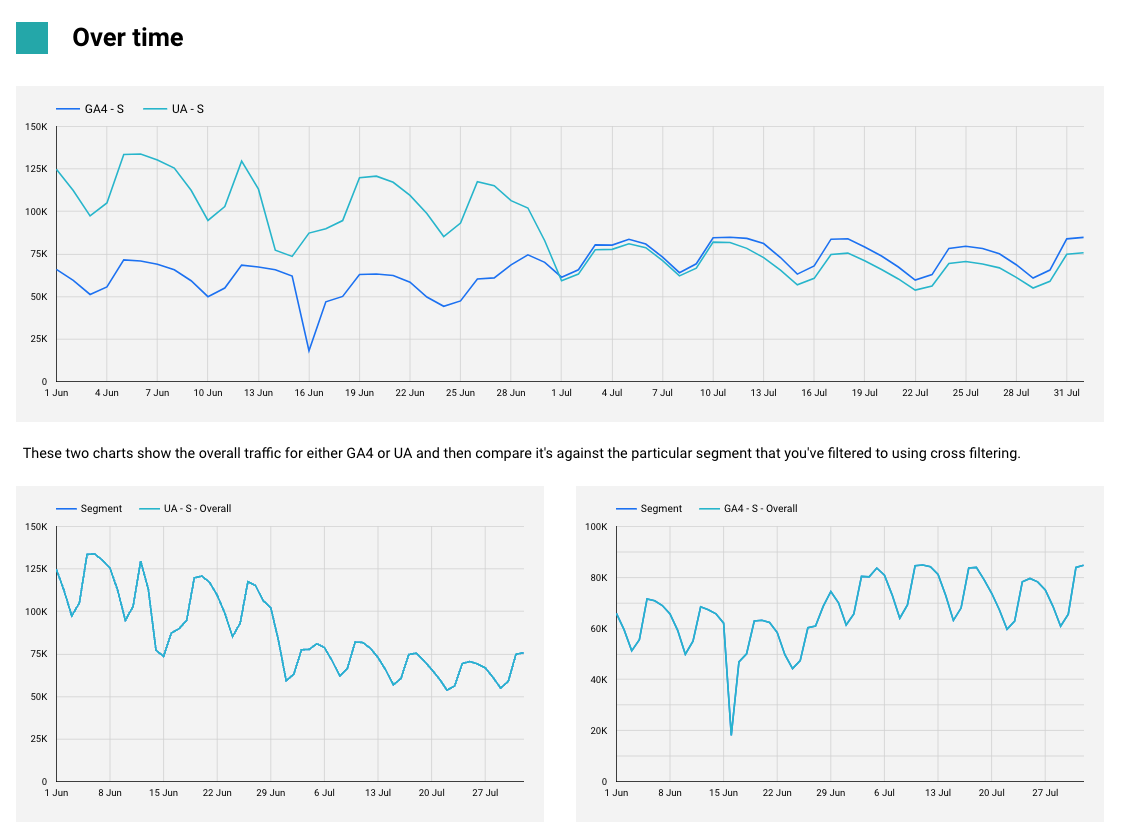
You can spot the point where GA4 got fixed and the metric (sessions in this case) came to the right level.
Accounting for differences in GA4 and UA?
What do we take away from that?
If we don’t account for differences in traffic we’ll end up anywhere from 2-15% (on average) different from year to year.
We need to make sure we account for that, or accept that we have a margin for error of 2-15%.
Accounting for the top level changes
First we just check our top level numbers. Which is easy enough:
- Plot GA4 metric
- Plot UA metric
- Estimated the percentage difference.
Accounting for dimension level changes
But we need to check this also applies to any dimensions we want to use.
- Pick the dimensions you want to compare across.
- Figure out the difference between UA and GA4 for those dimensions.
- If it’s not consistent across time and across the different dimensions you want to work with then be aware that your joined data might be inaccurate.
- If it is consistent account for that difference when forecasting or working with YoY data.
Let’s give that an example:
Suppose you want to compare country year on year for sessions. I’m going to do napkin math to help keep this easier to follow.
Find a period where we think GA4 was working correctly
i.e. probably not when you first set it up.
Suppose we pick June 2023.
First we check out top level numbers
Then we get average of daily session numbers:
- GA4 ~ 52k daily sessions
- UA ~ 54k daily sessions
That gives us an overall difference of about 3.5% more to UA. Not too bad.
Now we look at dimension level changes
Time to check the difference between the breakdown of date & country dimensions. What we want to do is:
- Get sessions per country for a period (e.g. 1 month).
- Get sessions as a % of total per country for GA4.
- Get sessions as a % of total per country for UA.
- Check to see if the relative percentages of traffic are the same.
Here’s all of that done in a table we have in our GA4/UA reconciling report to make this a bit more visual:
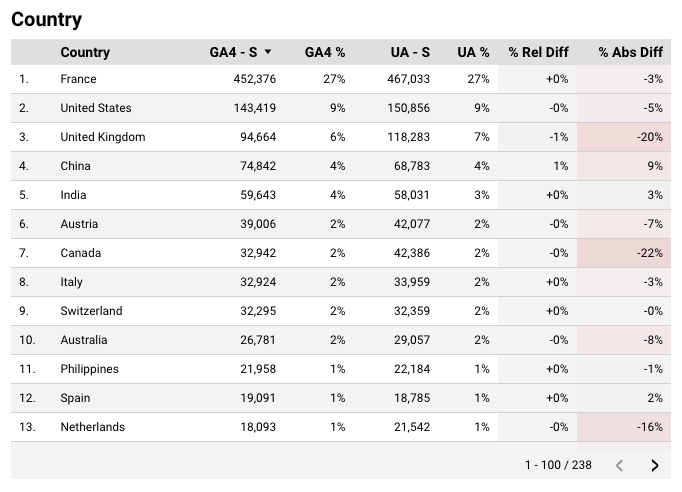
The crucial columns here is % Rel Diff. Here we can see the relative difference in how much traffic we get from each country.
The whole column is between 0-1%. Essentially the country traffic breakdown is close to identical between GA4 and UA.
This means we can go ahead and just compare using our top level differences. If it wasnt equal we’d also have to account for those changes.
What if the data isn’t consistent?
When GA4 and UA were setup correctly in the same way we found there were very few relative differences in the two, typically nothing more than 1-2%.
If we found bigger difference than that then 90% of the time there was an analytics bug (e.g. GA4 being blocked by country level security policies on the site) or configuration change (e.g. change in configuration of channel mappings).
If you do find this you’re going to want to investigate this a little bit deeper to discover if it is just a small variation or something more worrying which will prevent you joining the two.
How do you do this?
You can’t fix UA data any more, but we can still find out where the differences are and see if we can account for them or if it might be an issue with GA4 that we missed.
The best approach is to:
- Take the process for accounting for dimension level changes we went through above.
- Repeat for a bunch of fundamental dimensions:
- Country
- Source
- Medium
- Browser
- Browser Version
- Device
You can see an example of how to turn this into a process with our GA4/UA Validation template.
(It uses BigQuery rather than Looker Studio connectors, so you can’t use it as a literal template but hopefully it will be useful inspiration.)
How to connect GA4 & UA in Looker Studio
Great, we know what to watch out for lets actually do it.
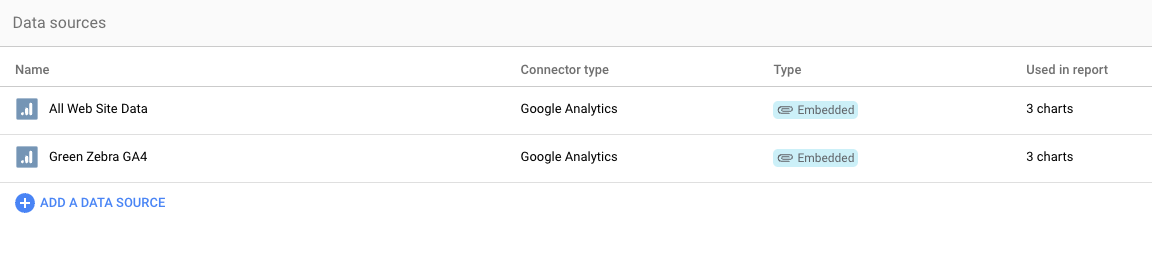
1. Open up Looker Studio and add both GA4 and UA to the same report.
We’re going to open up:
- Top bar > Resource > Manage added data sources
Then add two GA data sources, the UA and GA4 one.
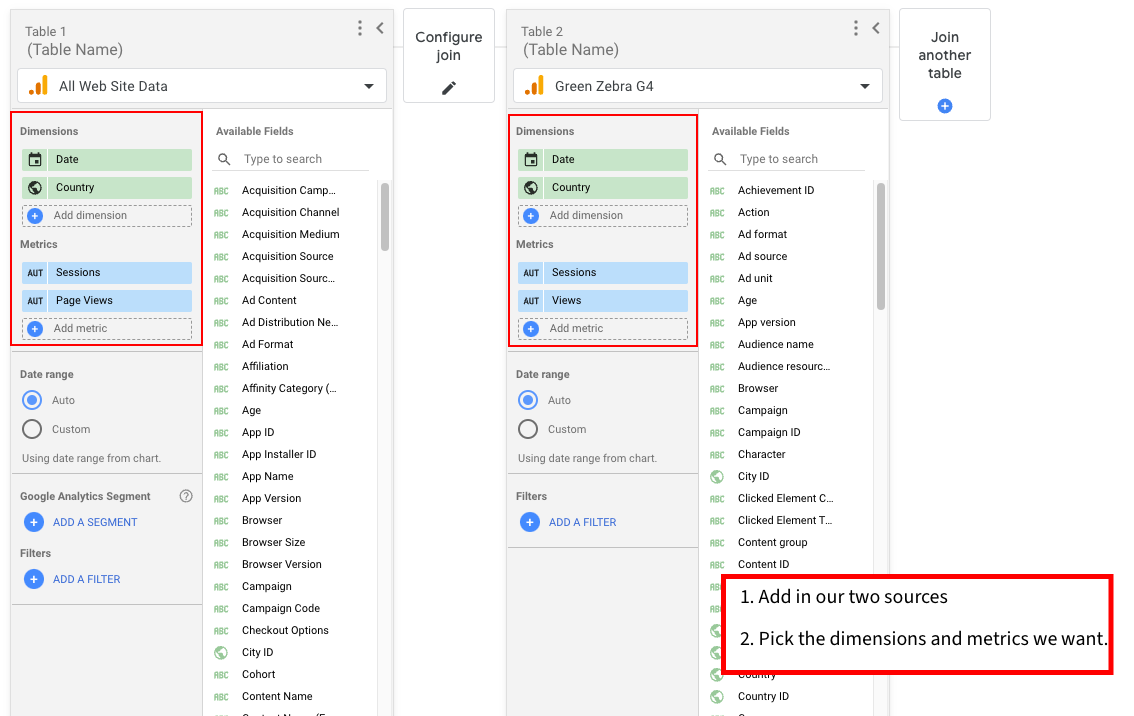
2. Add our sources to a blend
We now need to blend them together with the dimensions and metrics we want. E.g. if we want to compare UK and USA across sessions and views we’ll need:
- Dimensions: Date, Country
- Metrics: Sessions, Views
So we add the sources to our blend and add the dimensions and metrics we want.
Occasionally there will be slightly different names. E.g. Page Views in UA is Views in GA4. They’re technically not 100% identical but that won’t apply to most people reading this.
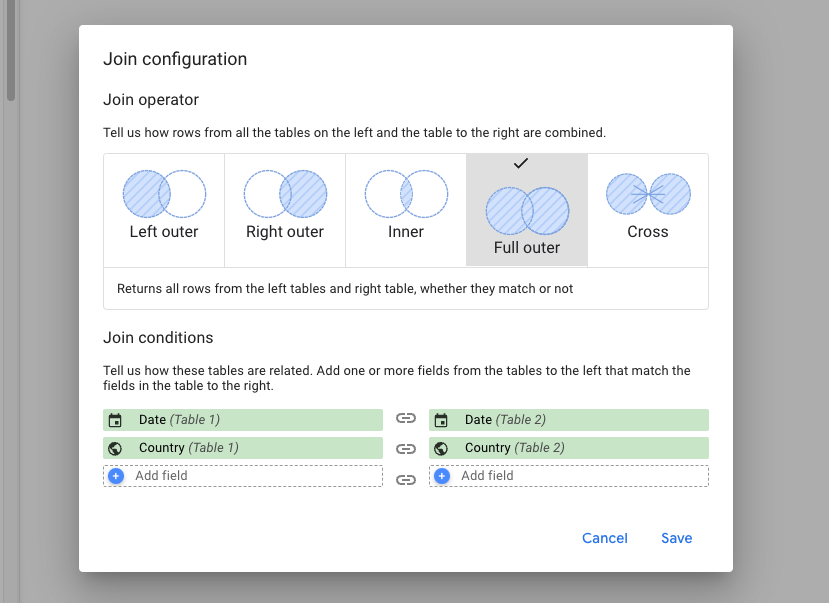
3. Configure a join for the blend
You want to join using:
- Full outer join.
- All the dimensions you have.
In our basic example that means:
- Date
- Country
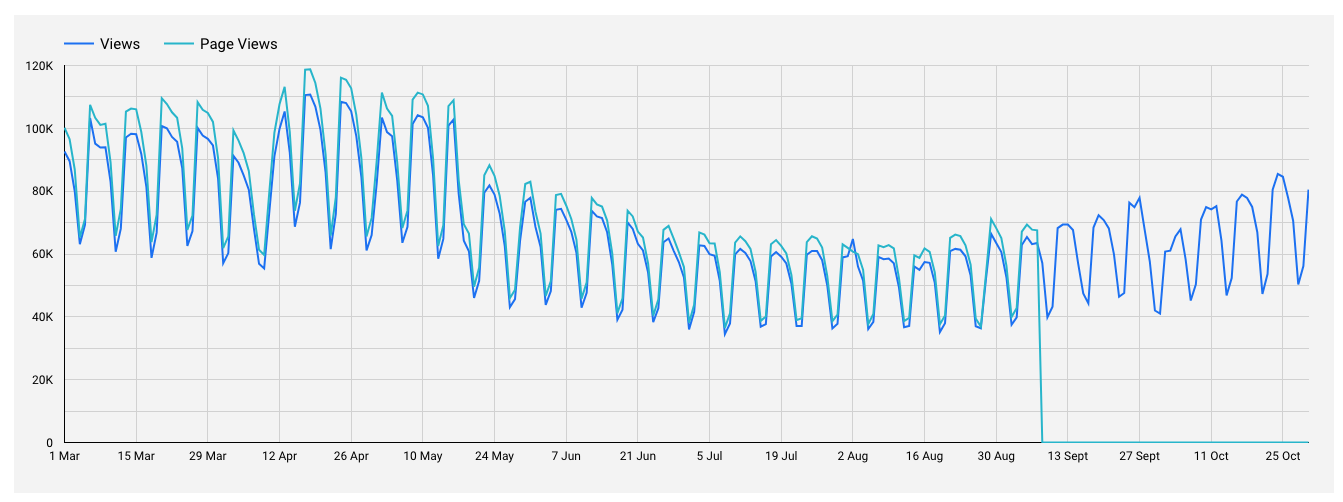
4. Plot our blend on a time series to check it all looks sensible
Did that work? Time to find out.
- Set the date range to a time period which covers UA (so somewhere around mid 2023).
- Plot our blend on a time series and check if it all looks ok.
We should see:
- A sudden drop off where UA stops tracking.
- Two traffic graphs which look roughly similar.
If we get massively different numbers or ones which don’t line up it’s time to head back to this section and run that process.
If you don’t we can move onto the final step!
5. Pick a date to switch over
Your GA4 data probably wasn’t perfect when you first set it up. Pick the date you want to switch from UA to GA4.
6. Join the metrics with a calculated field
Final stretch now. Time to make a line joining our two values together.
Now we need to be able to create calculated dimensions and metrics.
The only interface that exists for doing this in Looker Studio is by selecting a specific chart/table and doing it on the chart/table. You can’t do it in the blend.
Create a blended date dimension
Select our graph with the blended data, then click on the dimension and hit add field.
We’re going to make a new field called:
- Name: Date (UA +GA4)
- Formula: coalesce(Date 1, Date 2)
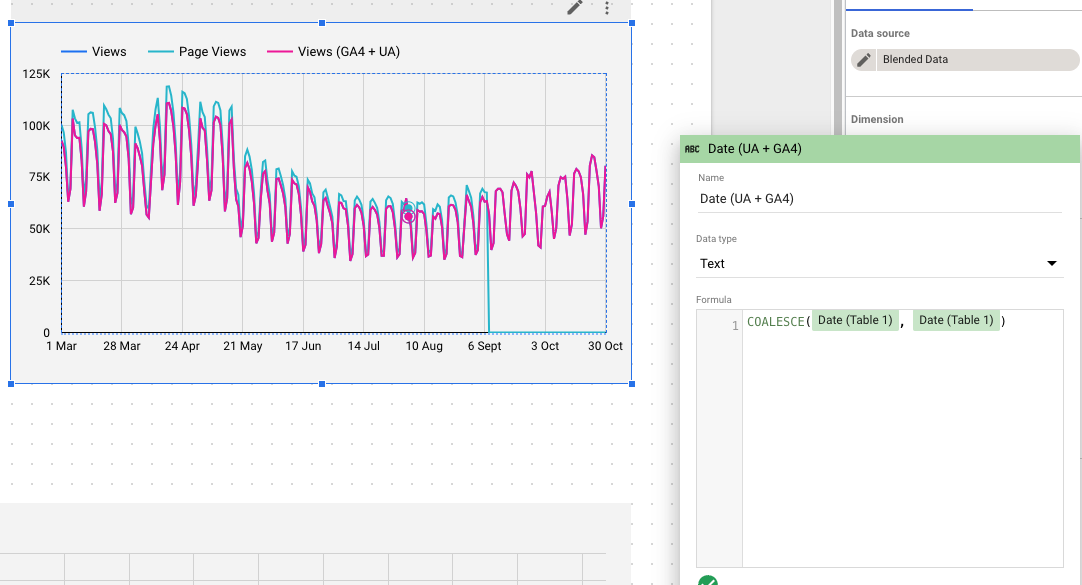
You can put the dates in either order here.
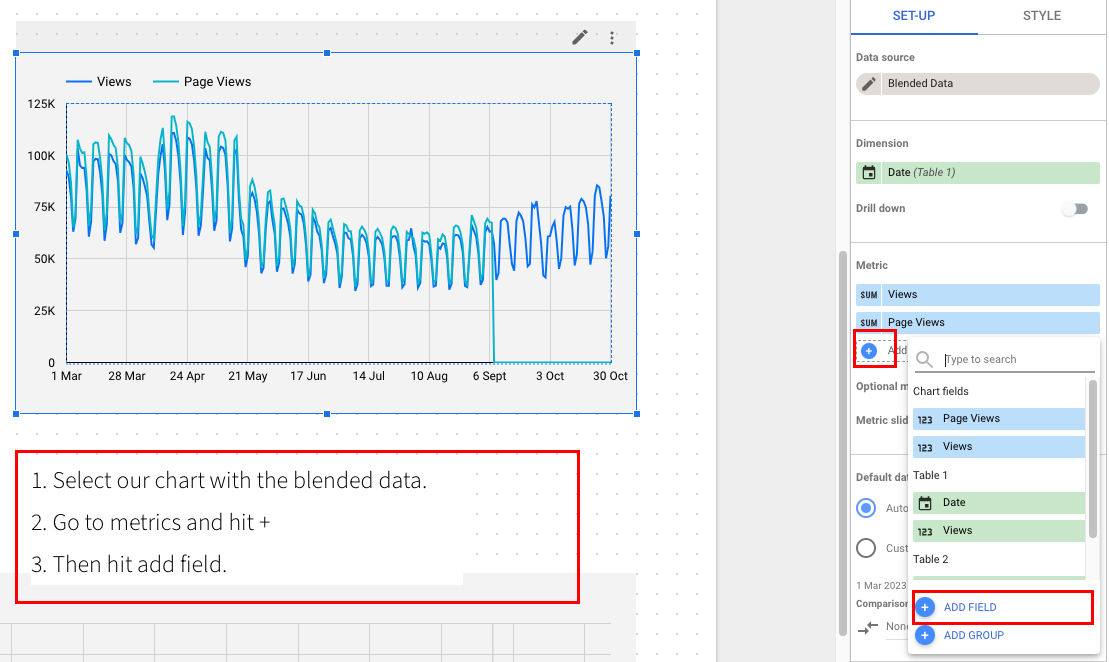
Create a blended metric
Then go to metrics, add a new one and hit “Add field”.
Then we’re going to call it something like:
- Views (GA4 + UA)
- Make sure you put GA4 and UA in the title so you remember what this is.
And then for our formula we’re going to put:
if(
    cast(coalesce({ga4 date}, {ua date}) as date) >= date(2023, 6, 1),
    {ga4 metric}*{our traffic adjustment},
    {ua metric}
)
If we need to make multiple adjustments (e.g. organic gets less traffic than the rest of the site) then we'll need a case statement version:
x
case
    when cast(coalesce({ga4 date}, {ua date}) as date) >= date(2023, 6, 1) and coalesce({ga4_country}, {ua_country}) = "gbr" then {ga4 metric}*{our traffic adjustment for gbr}
    when cast(coalesce({ga4 date}, {ua date}) as date) >= date(2023, 6, 1) then {ga4 metric}*{our traffic adjustment for non gbr}
    {ua metric}
end
The crucial parts to this are:
- Replace the dates and metrics with the relevant UA/GA4 metrics.
- Replace the date with the correct switch over date.
- Replace the traffic adjustment with whatever % we need to adjust by.
(If you know about SQL and are baffled as to why I have casted a coalesced date to date, so was I. Apparently Looker Studio has a tiny heart attack otherwise. Something something it hates nulls?)
Once you’ve done that you’re finally here! We get our graph.
Google is due to delete UA properties mid this year
Google is due to delete all the UA data by 1st July 2024.
I suspect this method will stop working because the data will be deleted so there will be nothing to join.
(I suppose it's possible they keep the data, but sunset the front end? But I think that is unlikely.)
You'll need to backup your data into something like a data warehouse to do this process at that point.
We'd broadly recommend BigQuery because at that point the rest of this process, is almost identical except you'll choose a BigQuery table rather than the Looker Studio data connector.
Questions
If you've got any questions please tweet us (personal account is @dom_woodman).
And if you'd like help with this please get in touch.
We help marketing and SEO teams get a handle on data problems like these.
If you're finding Looker Studio slow, or want a simpler set-up where you just have a single data source please it's the sort of thing we can help you with.