Why is my Looker Studio dashboard slow and how can I make it faster?
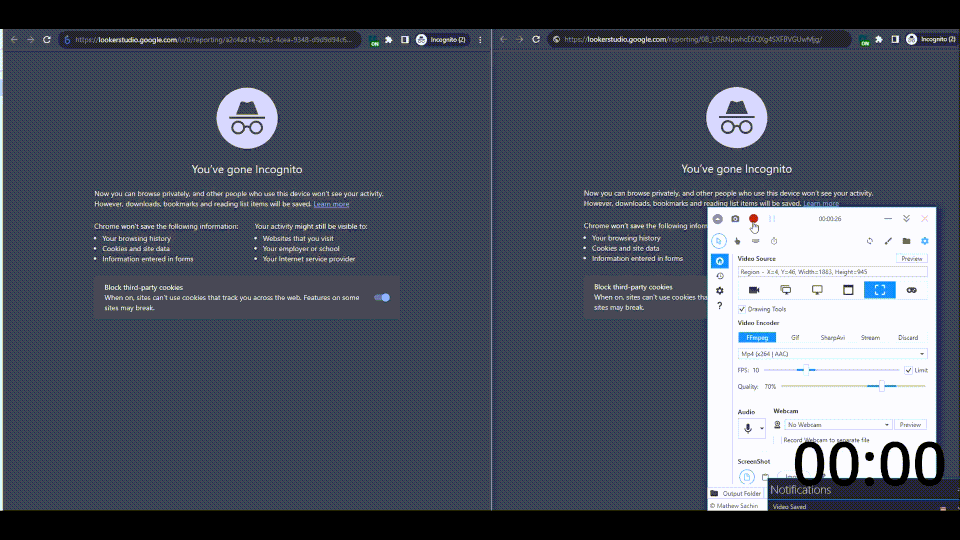
How do we take the Looker Studio (Data Studio) report on the right and make it run as fast as the one on the left?
Full disclosure. There are no easy solutions to this problem. But let's unpack and we'll see what the options are.
There are four primary things that might be slowing viewing & editing your dashboard, (ordered here by how likely is they’re causing you issues).
- Too many data sources
- Too much data/data processing
- Too many charts
- Bonus: too much formatting
With the possible exception of 2, all of these are probably fundamental to it. But let's see what we can do.
Then there a couple things which will slow down editing your report:
- Remember to pause updates.
- Watch out for extensions
- Set the date range to a single
How Looker Studio works
To understand all these problems and how they might be affecting us we’re going to need to understand roughly what happens when you open a dashboard.
For each data source (and graph that belongs to that data source) the following things happen when you open a dashboard.
First open
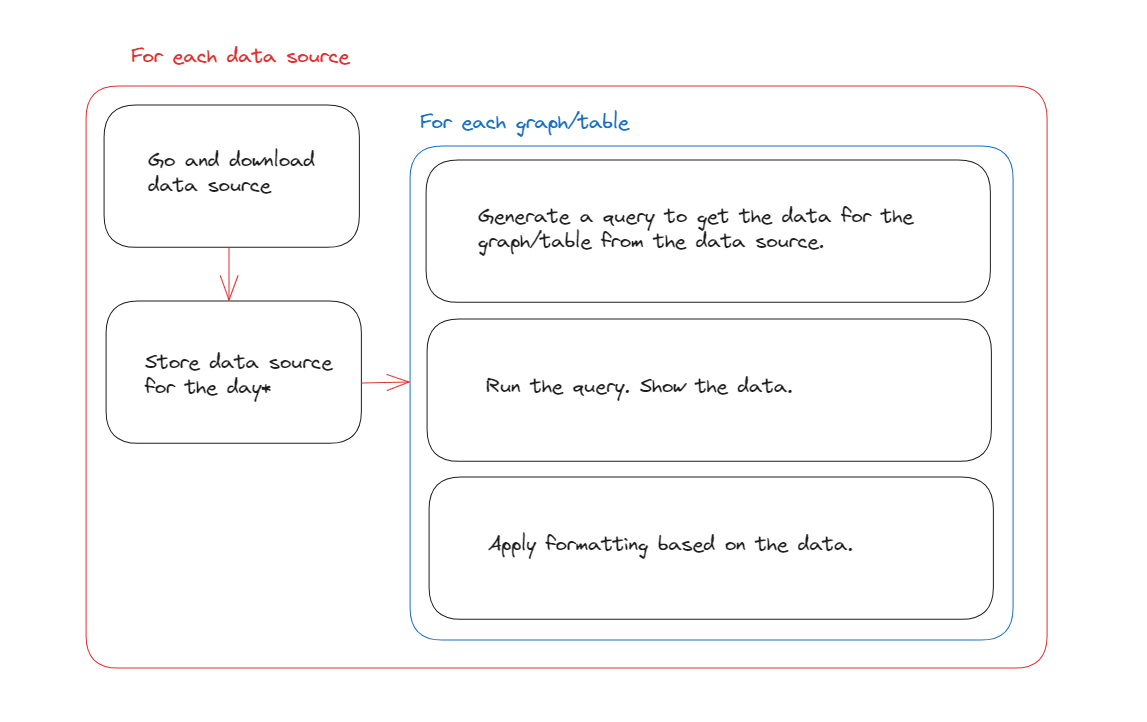
- Go and download every data source for the period selected typically from an API.
- Store those data source results.
- Generate a query for each individual graph/table. (i.e. which data do I need from the data source of this table).
- Run the query and show the data in the component.
- Apply formatting based on the results of that data if needed.
Repeated visits
That’s on first open.
After it’s run for the first time, then Looker will have cached all of the data sources for the day (or however long you’ve set the cache).
And it will have cached all the individual charts you have.
So when you re-open it the dashboard will load much faster, until you start doing things to ask for new data.
- If you refresh the data or change the date range it will have to go and regenerate some or all of the data source.
- If you apply filters, sort etc. it will have to re-run the queries for the individual tables you’re changing.
Sidebar
What is a cache?
A cache is a data store, which saves results after a calculation so you don’t have to repeat the calculation.
Caching something speeds it up on everything except for the first run.
What is a query?
When you have some data stored and you want to go and fetch it Looker Studio is running a query.
On the back end it’s stored a table with loads of columns (e.g. country, device and clicks).
Then when you make a table for showing clicks per country, it runs a query to turn the backend table of country + device + clicks, into just country + clicks.
When we use query, we mean - "go and get the data!"
1. Too many data sources
With that context:
If you have too many data sources, then every time you load the report it’s going to download all of the data from all the different sources before it even begins on starting to generate your graphs.
And that’s gonna be slow.
Every data source you add is going to slow down your report by a bit.
Sometimes each individual table is it’s own data source
Great you’re thinking. I only have one Google Analytics/ Search Console data source. That’s only 1 source, it won’t be too slow.
Unfortunately sometimes each individual chart counts as it’s own data source.
So if you have this:
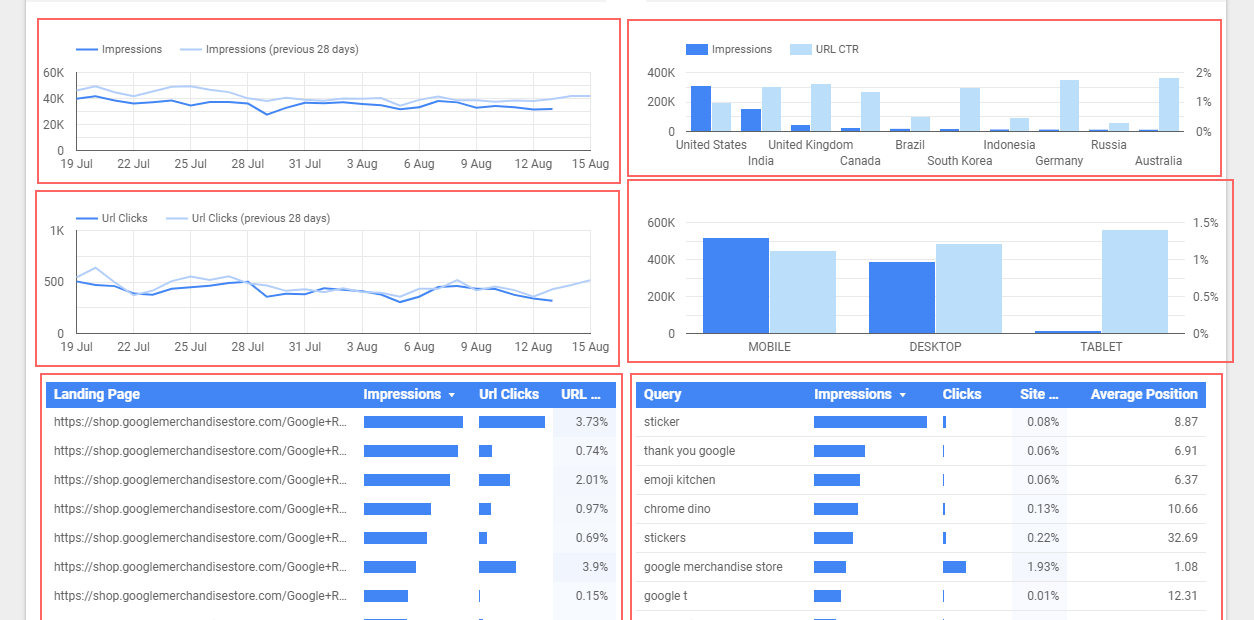
Each of these components is fetching its own data from GSC API every time you load the report.
This is dependent on the connector, but for things like Google Analytics and Search Console, unless your tables have all the same dimensions and metrics, Looker is fetching them individually for each different chart.
And guess what it’s gonna make it sloooow.
It might be doing some batching at the back end, but I haven’t read or seen anything confirming that so I would assume it probably isn’t.
2. Too much data/data processing
Large sources
If you give Data Studio a source with a lot of data it will slow down because it has to process a large data source. The larger the source the longer processing.
Complex sources
On the other end if you're doing a lot of data processing:
- blending data
- categorising data
- custom functions
Blending is typically the biggest culprit here.
Then after Data Studio has downloaded all the data from the data source, then it needs to go and do all the data processing.
And again all of this has to happen before we can even show a chart.
3. Too many charts
Each chart generates a bunch of processing which will happen on your computer (i.e. client size) so if you have enough of them on a single page then the dashboard will slow down.
Too many charts also means you’re probably doing 1 & 2, which are more serious, but a large number of on page elements will also cause it.
4. Too much formatting.
The final step Looker Studio does, is to take all of your charts and once the data is in them, format them based on the data in there.
If you have any particularly large tables, then the conditional formatting in particular can make your dashboard quite slow to use.
How can we make a Looker Studio dashboard faster?
Right the good stuff. How do we fix it, unfortunately all the easy ones are all going to restrict what you do with your dashboard, but that’s the trade-off.
1. Turn the longer caching period back on
The first thing we can trade off is data freshness. By default Data Studio fetches data once a day and then stores it.
If for some reason you've turned it to less than 24 hours, it's time to turn it back.
The following menu path will take you there:
[Resource] > [Manage Added Data Sources] > {Select your data source} > [Edit] > [Data Freshness]
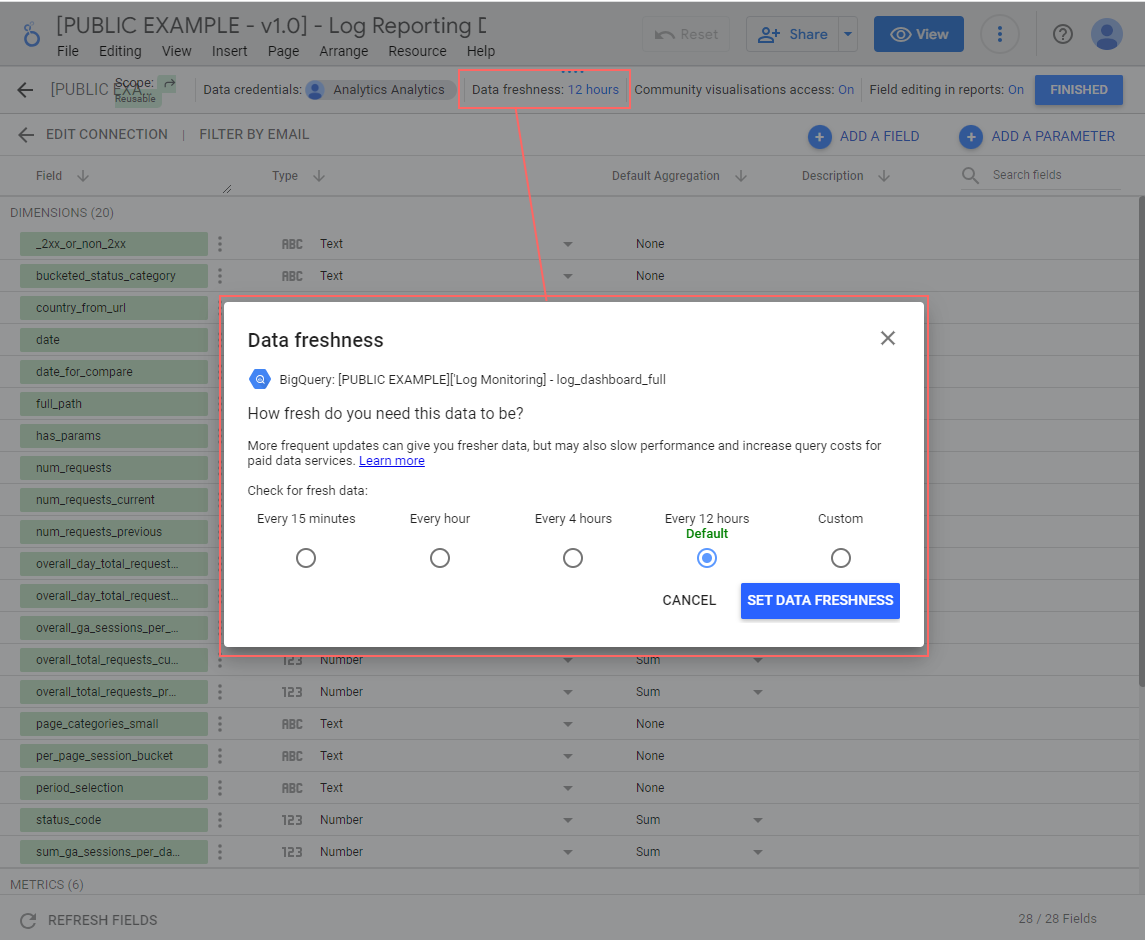
Unfortunately this won't be an option for most people because as we mentioned, it already defaults to the max length.
2. Split data source by page.
Looker Studio only loads the data sources you use on the page.
So if you only show charts from a smaller number of sources on one page it will take less time to load.
Remember this also applies to individual charts which are pulling in data unique to them.
This is of course a relatively large constraint on a dashboard, but it is sometimes helpful.
3. Split up summary data and drill downs
Cross filtering is incredible, we love it. But it does push you towards putting all your data on one page.
If you’re struggling with speed take the tables which do all the drilldown into lots of different dimensions and put them on a different page from your summaries.
Your summary page will load faster and it’ll only slow down when you get to the drilldown page.
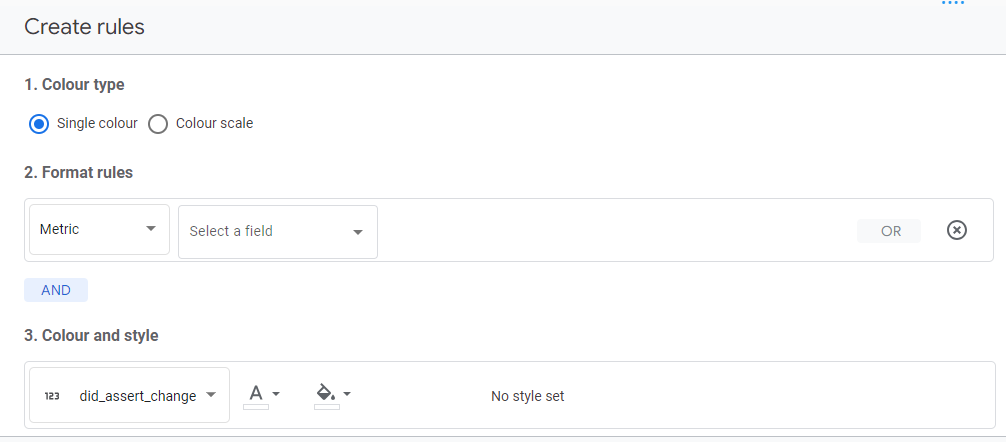
4. Heatmaps perform better than conditional formatting
Not sure why but they do (probably how they’re coded).
If you’ve got a really big table/pivot table and you need colour conditional formatting may be very slow.
If you can use a heatmap instead it’ll speed it up.
5. Do the data processing before it reaches Looker Studio
Let the harder (but more effective) options begin.
Looker Studio is best when it’s used for display. In the ideal world you want to do all of the data processing before it ever reaches Looker Studio.
Unfortunately this is non-trivial (we have a business in part because this is hard).
You typically do this by pulling your data into a data warehouse (like BigQuery or RedShift).
Because all your data is already downloaded and ready to go, Looker Studio only has to go and run the queries and if you’re building data pipelines it might not even have to do much of that!
This is by far the biggest saving in speeding up your dashboards and it means you can make them far more powerful. But it is a big time and effort investment.
If you are in the process of doing that, then there are some additional steps you can do to speed things up with your pipelines that we’ll go through now.
(And if you'd like some help with that please get in touch, it's what we do!)
6. Build fixed time views
Sometimes users will use time in a predictable way.
If there is a particularly common timeframe you can pre-build a fixed time period table and then generate 2 pages in a looker studio report:
- Fixed time period
- Custom time period
80% of user needs are met by the fixed time period which loads instantly because the query is already complete, the other 20% can use the custom period.
We’ve used this on our ranking report here as with rank tracking you’re typically wanting to look at the most recent set of days.
The first page shows the most recent 56 days and loads very quickly, the second page is slower but you can set to whatever time period you want.
7. Adding cardinality in
Cardinality is where if you have more than X rows, you roll-up the remaining rows and call them (other) , Google Analytics is where people most commonly see it.
Often we’re in the business of removing cardinality. People come to us because they want all the their data and to avoid it. But occasionally in a dashboard it can be a good thing.
Returning a monstrous dataset will cause Looker Studio to slow down and sometimes you don’t need it.
In those cases generating cardinality can massively speed up your dashboard.
An example
Take our log monitoring dashboard We take each combinations of segments e.g.:
- Category
- Status Code
- Country
And for each combination we pull the top 5 URLs the rest we roll-up into other. Looker Studio can't handle the millions of rows you'd see otherwise.
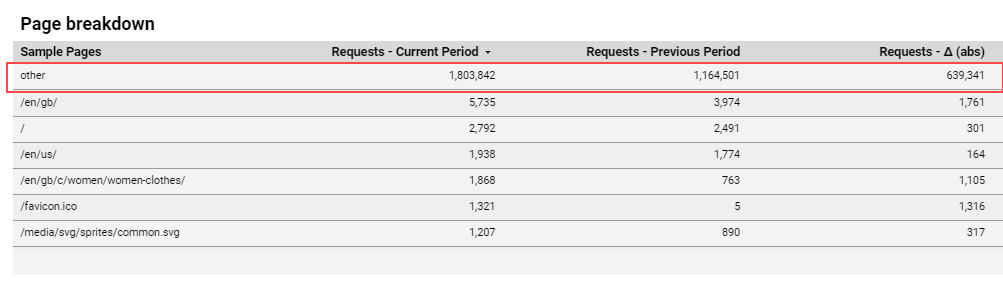
When you’re debugging status codes in a log analysis, you need to dig into where they’re happening (on which template, which country etc.) but all of those should be segments.
By the time you’re getting to specific URLs you just want a list of examples to go and find out what is happening or put in a ticket.
A giant list of individual pages with log counts isn’t going to help someone any more at this point and it will slow down the dashboard, so we roll the rest into (other) and the dashboard runs notably faster because of it.
That’s all folks
So maybe that has been helpful?
Speeding up dashboards without going to data warehousing often means compromising on your dashboards in some aspect. Think hard about your audience and what you really need on each page.
Or take the plunge and get yourself a data warehouse and all the benefits that come with it.
If you’d like our help on that part, please get in touch. Setting them up and managing them is exactly what we do best!