GA4 Migration - Setting up the backend
Like many other people involved in the analytics industry we've been seeing a fair few GA4 setups/migrations.
 RIP old friend.
If you're still wading through it here are some broad things to think of this month and going forward into the new GA4 world.
What will this post cover This post is going to cover things you should think about with the backend part of a GA4 migration. i.e.
- Validating your GA4 data
- Joining UA & GA4
- Running GA4 BigQuery
- Building GA4 dashboards
What won't this post cover It won't cover one large chunk of a migration which is:
- Digging around in a tag manager instance and setting up events.
That’s because we don't usually do that as a business and there are other better people to talk about it.
- What should I track?
- Turn on your GA4 BigQuery export
- What should you backup from UA?
- How different are UA & GA4 numbers?
- Validating your GA4 & UA numbers
- Joining UA & GA4
- What’s the best way to make dashboards from GA4?
- Can I copy and paste this SQL I found online to get GA4 numbers?
- That's all for the moment!
Onwards!
What should I track?
Ok so we do need to briefly talk through one "front end" step. What do you migrate?
GA4 is there being overwhelming and you have a large GTM set-up and lots of options. Where do you start?
Bring over:
- Any conversions you had as goals.
- And turn on enhanced measurement.
From the backend perspective the answer to "what should I track" is basically "the more the merrier" because we get a raw export.
You can always turn them off later when it turns out you don’t need them and unless you’re a very large website it’s unlikely to have much of a cost.
If you're missing more detail. Jill wrote up an excellent top level ga4 summary almost 2 years ago that is a really good birds eye view.
Turn on your GA4 BigQuery export
If you take nothing else from this blog post please: turn on your GA4 BigQuery export.
It doesn't backfill and if you're not actively using the cost is tiny (because BigQuery primarily charges on usage). Turn it on now and in the future when you run into limits with the UI and bring someone on to help you they will be super glad you did.
But we haven't finished setup - Don't worry if your tracking isn't fully correct, something is better than nothing and it'll give you more overlapping data to see the differences.
But I'm only using the interface - Excellent that's great! But as your analytics needs get more complex in the future there is a really good chance you want the BigQuery data, the cost of storing it is really small and you can't get it from the past. Save yourself future pain!
We're putting together a separate post to walk you through the steps, which we'll have up next week if you do need the help!
What should you backup from UA?
GA4 will be the source of analytics going forward, but it's a good idea to back up the old UA data to allow you to look at previous performance and trends.
If you've no idea what to backup then a good guideline is to try and back up metrics for each level of granularity that GA lets you track at. That’s:
- page level
- session level
- user level
I.e. you want a table with session metrics, user metrics and page metrics.
The closest parallels in the interface would be the following reports:
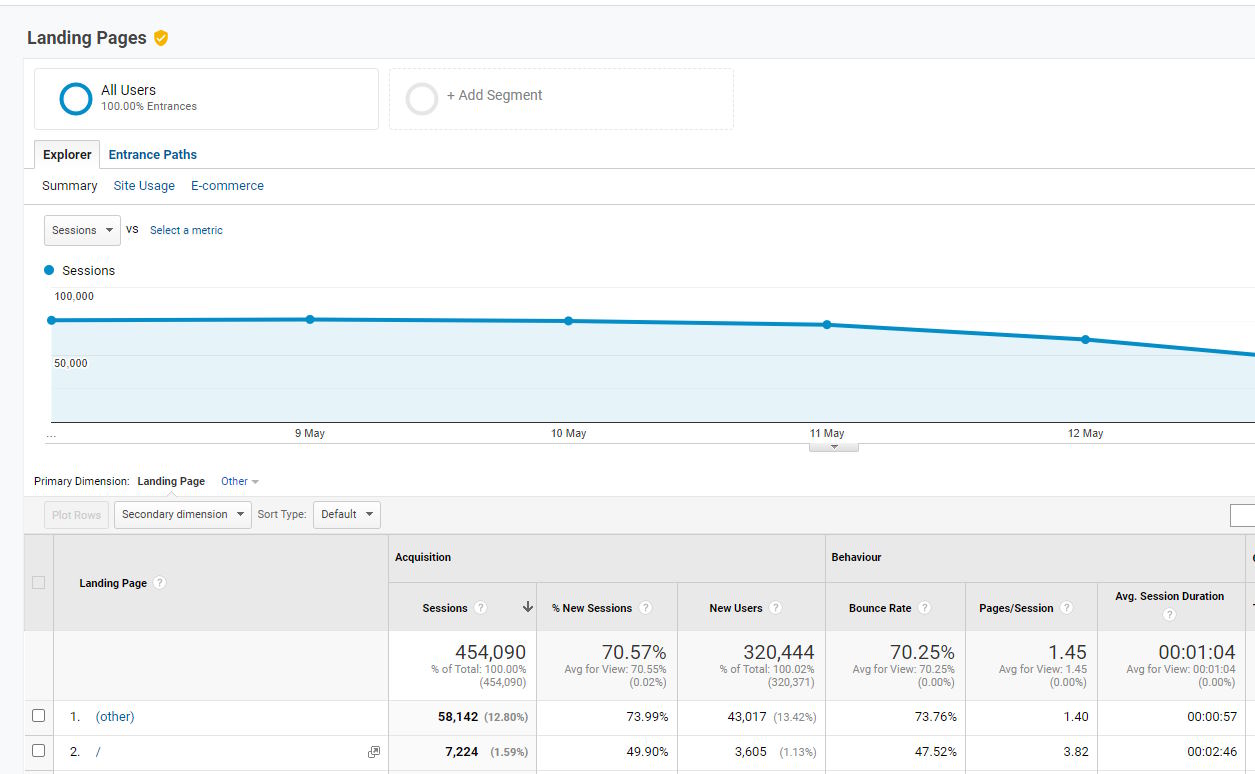
- Landing Page Report
- All Pages Report
And there isn't a perfect match for users. There’s quite a lot to this and so we're also putting out a separate blog post for that next week too.
We have an email list if you'd like to see when it comes out!
How different are UA & GA4 numbers?
Sessions & Users
Sessions & users can be quite different. Broadly we've seen it be somewhere in the region of 2-20%.
If you're getting into close to/over the 20% difference it's more likely either you had something wrong with your UA config (e.g. session splitting) or you've got something wrong with GA4.
(The example numbers I'm showing here are from the BigQuery side, there can often be fewer users specifically on the interface side because Google Signals can be used to roll-up different device users.)
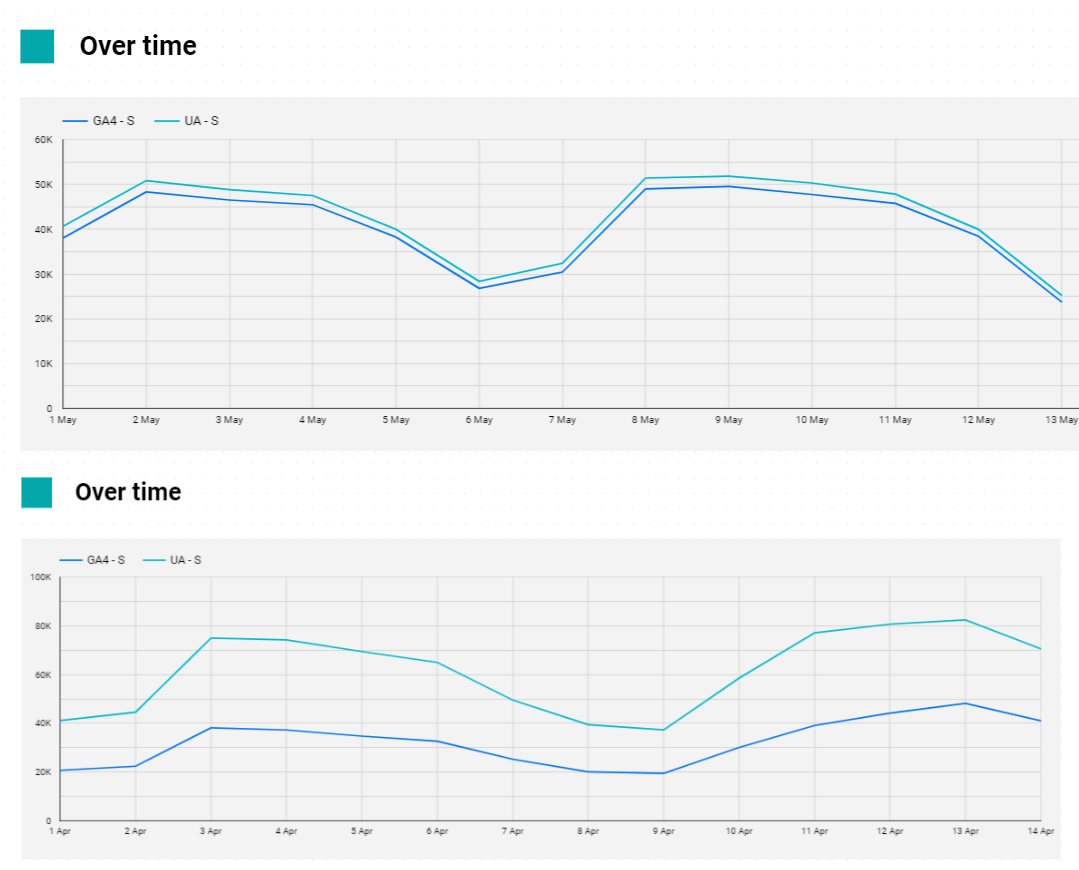 Sessions for 2 different websites. One good migration, one bad config
Individual events - e.g. pageviews
Individual events tend to pretty close to the numbers. We typically will see events like pageviews come within 1-4% of UA numbers.
Goals
Goals can vary in a similar range to sessions, but the underlying events tend to come far closer (mostly within 1-4%).
Rather than trying to validate the goals, it's far easier to validate the events triggering them if you have an event or destination driven goal because again individual events counts should be quite similar.
Let’s move onto validating.
Validating your GA4 & UA numbers
How do you know if your GA4 is set-up correctly?
Other than total mastery of your tag manager set-up, one relatively easy way to do this is to compare your GA4 numbers to your UA numbers.
Event level
Ideally you want to do this on an individual event level (because we get to bypass the session & user logic which are different).
The primary steps for doing this are:
- Pick an event.
- Build a custom report in UA with a set of dimensions and that event.
- Build a custom report in GA4 with a set of dimensions and that event. (use the same order of columns)
- Download both sets of data.
- Add a column to each which says "ua" or "ga4" respectively.
- Open both sets of data and paste one below the other.
- Pivot the data in a tool of your choice to compare!
What’s an example table?
An example of a good table to compare would be something like:
- Page Path
- Country
- Device
- Browser
- Pageviews
Here are screenshots of the table build in both GA4 & UA.
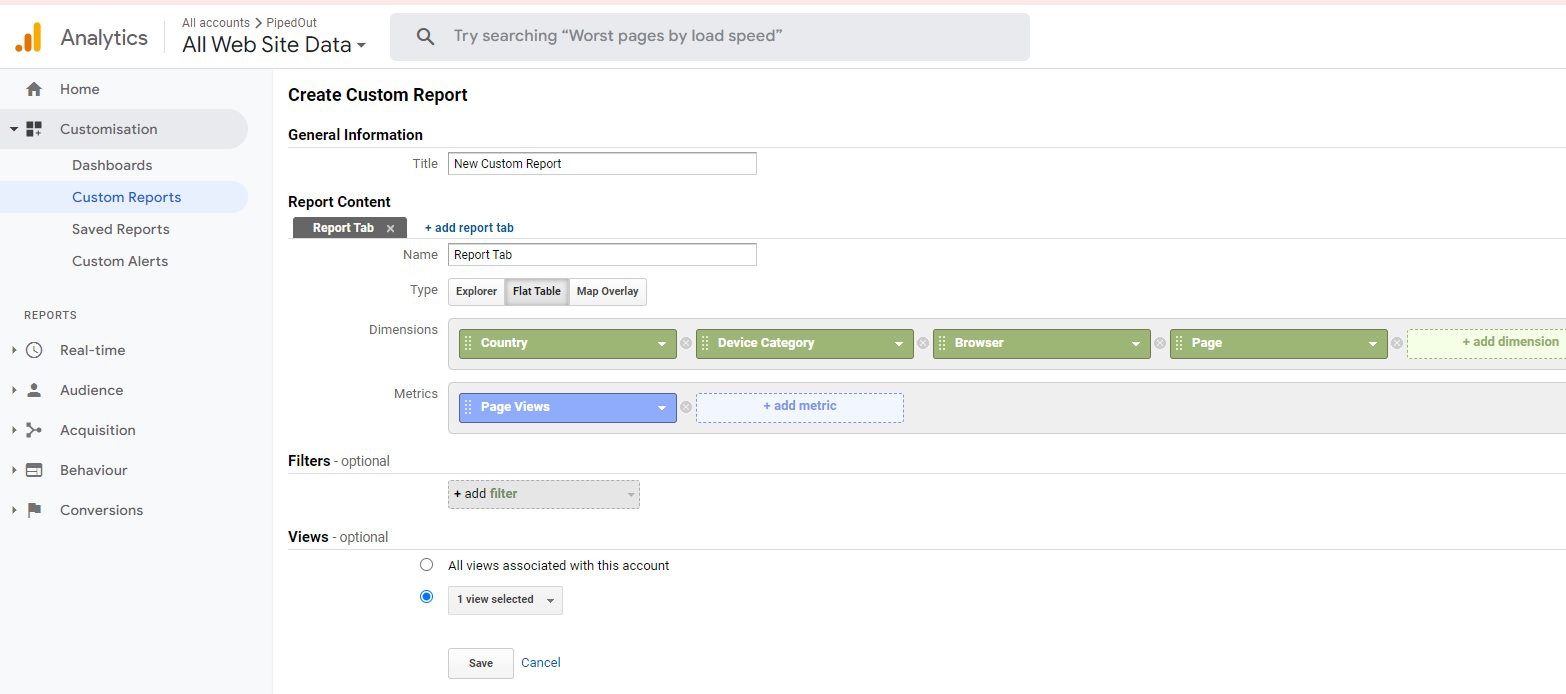
Custom table in UA
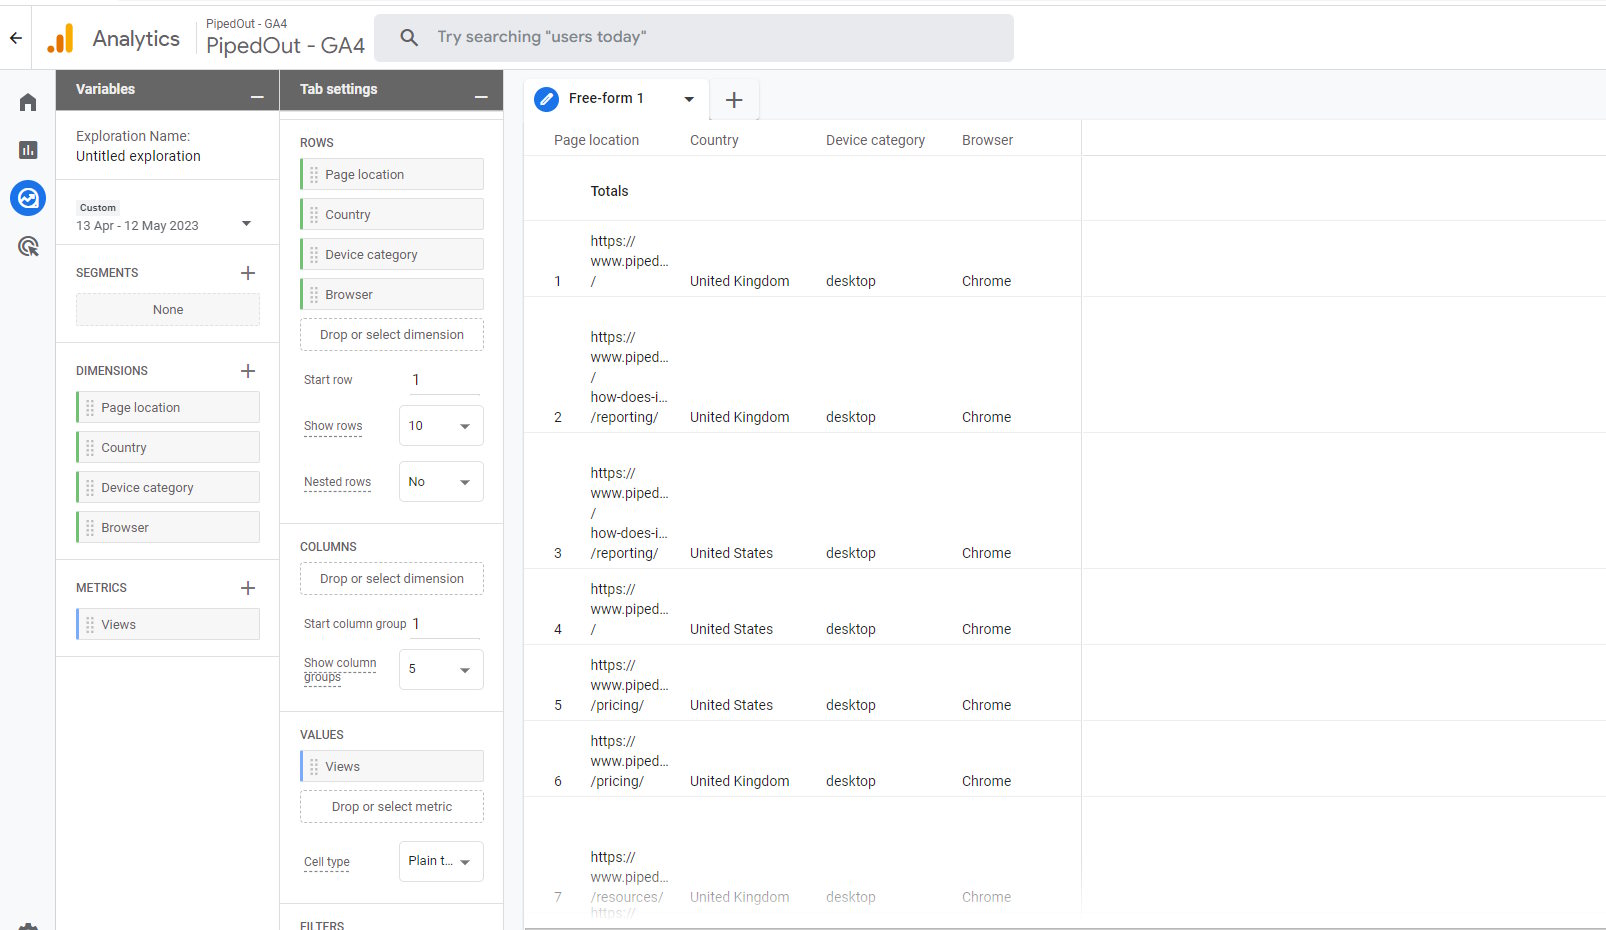
Custom table in GA4
Then download all that data and follow the rest of the steps.
What does the comparison look like?
What do you get at the end? Here's what we have: a dashboard template we use for this purpose.
This is a public report, so the numbers are made up (i.e. don't read too much into them. But it should show you what the output looks like.)
Essentially to build this we followed the steps above, only we've used data pipelines and dashboards rather than Excel. But the process is identical.
The rough structure of the pivot is this:
- Column: Analytics Type (GA4 or UA)
- Rows: Dimension of choice (e.g. device)
- Values: Event count of choice (e.g. Page views)
And then it's helpful to add on some additional calcuations.
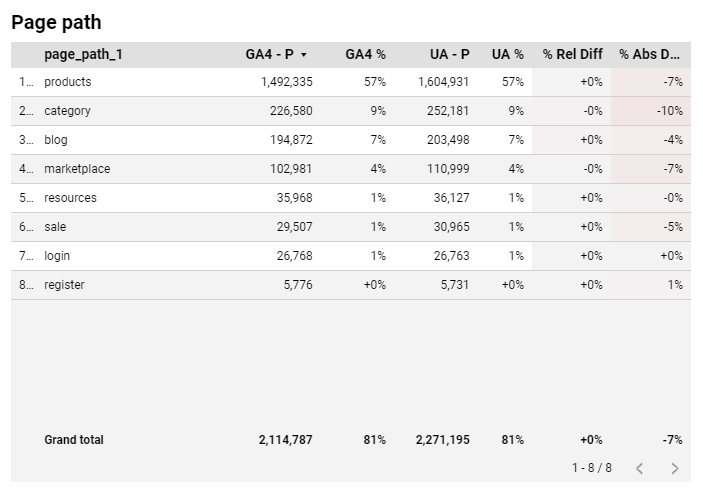 Here is an example of a pivotted table.
Specfically it's useful to calculate the relative breakdown percentage differences.
- i.e. 20% of our sessions were from desktop on UA and 20% of our sessions are from desktop on GA4.
And then absolute differences from UA to GA4
- i.e. We have 15% fewer sessions in GA4 than UA.
Goal validation
One additional note on goal validation. A goal can only fire once per session.
In GA4 you can choose if a goal can fire once or multiple times.
Make sure your comparing apples to apples. (If you have the BigQuery export you can choose after the fact, if you're in the interface you can't.)
As mentioned above we'd highly recommend validating the underlying events rather than the goals if possible.
Why does this work?
This works because thankfully Google have made our life relatively easy here.
Field names changes from GA4 to UA i.e.
- UA: Device was called
ga:deviceCategory - GA4: Device is called
deviceCategory
But the actual values stay the same. i.e.
- UA: Accessing a site on with a mobile will record the value "mobile" in
ga:deviceCategory - GA4: Accessing a site on with a mobile will record the value "mobile" in
deviceCategory
This is great because it means you can essentially download data from UA and GA4, with the same columns and paste them into the same table then pivot to compare. (or UNION ALL if you're thinking about SQL.)
Joining UA & GA4
GA4 & UA don't exactly line up, there is no perfect solution to this. They don't measure things identically.
But we can work around it in a couple ways to at least minimize and explain:
- Provide historical numbers: Present your business both numbers with overlap to provide context - UA & GA4
- At this point this will have to be primarily historical because it's about to be turned off.
- Event level reports: In the case where it's event level (e.g. pageviews) the change may be small enough that you can just put them on the same chart and mention the small difference.
- Session/user level reports:* If you have enough overlap between UA & GA4 and the difference is consistent then you can alter your historical UA to bring it down to GA4 levels or vice versa. I.e. if your GA4 sessions are consistently 22% lower than UA sessions, you can multiply either of the numbers to correct it. In order to do this you need at least a month or 2's data to know the relationship is roughly consistent.
- Important: This is absolutely a temporary solution while the organisation gets used to the new numbers. But organisations move slowly and this can be a good stop gap.
What’s the best way to make dashboards from GA4?
The BigQuery export! (I hope you turned it on when we mentioned it earlier).
Hooray, if you love data. Not hooray if you wanted an easy answer 😟
The Looker Studio connector is fine. If you’re small it’ll be a bit slow, but should serve you ok.
But if you’re any decent size there’s a good chance you’ll run into quota issues or just the limitations with it.
Like some of the other questions, there is no quick answer to this question. We’re planning on putting out some guides to it, but in the meantime:
I’m in a rush.
Get in touch! Managing GA4 pipelines and building dashboards is what we do.
I want to learn.
If you’ve got some time to learn, then it’s time to start brushing up on your SQL.
Broadly we’d recommend:
- Get a ChatGPT subscription
- Signup for the Code Academy SQL course
And a personal recommendation an old colleage of mine Robin Lord, made an excellent SQL based learning game which is worth a look:
Can I copy and paste this SQL I found online to get GA4 numbers?
Maybe? We’ve got a helpful flow chart for you.
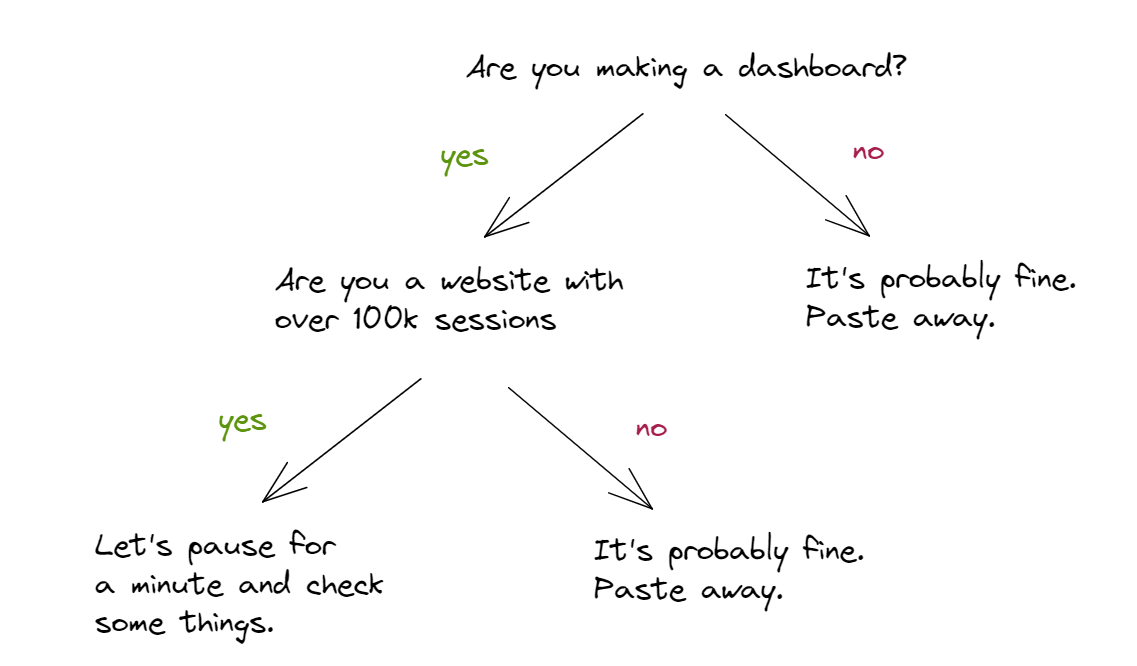
90% of the time I'm all for pasting random SQL you found online/from ChatGPT into BigQuery/Looker Studio. It's how I got started on this part of my career!
But there are some things we should check for the GA4 BigQuery export, because the export can get quite large. Particularly if you’re a larger website with hundreds of thousands of sessions.
Without diving into all the details there are 2 immediate things to think about:
Find out on much data you generate a day
- Open your table in BigQuery
- Go to the tab.
- Get the size and divide by the numbers of days since creation.
If it's GBs per day then it's probably time to start thinking about good data practices. That's too long to get into here, we're writing another entire post which we'll link here when it's done.
If you're putting the query into Looker Studio are you using date parameters?
Queries you put into a dashboard get run more, so those are the ones to be really careful with.
Here's an example query for extracting pageviews from GA4 BigQuery data.
select
    device.web_info.hostname,
    countif(event_name = 'page_view') as page_views
from
    -- Pick your analytics profile
    `ga4bigquery.analytics_XXXXXXX.events_*`
where
    -- define start and end date
    _table_suffix between '20220901' and '20230201'
group by
    hostname
order by
    page_views
Before copy and pasting this into Looker Studio we can add one notable thing which will make this better.
We can add the following WHERE clause. This means we'll use the dates selected by the Looker Studio date widget.
select
    device.web_info.hostname,
    countif(event_name = 'page_view') as page_views
from
    -- Pick your analytics profile
    `my-dataset.analytics_XXXXXXX.events_*`
where
    PARSE_DATE('%Y%m%d', _table_suffix) >= PARSE_DATE('%Y%m%d', @DS_START_DATE)
    AND PARSE_DATE('%Y%m%d', _table_suffix) <= PARSE_DATE('%Y%m%d', @DS_END_DATE)
group by
    hostname
order by
    page_views
If you're putting a query into Looker, made sure you check the parameters and add the WHERE clause.
That's all for the moment!
That's all for today. May your migration go smoothly.
If you've got any questions please reach out on Twitter!