
Contents
How to control GA4 BigQuery Costs
The first thing to note here, is that if you’re not already importing your data to BigQuery, you should be. The perks of doing it far outweigh the costs especially if you’re a big site.
As you get bigger, though, your costs increase.
So let’s bring them back down.
In this blog we’ll walk you through:
- Why and how your GA4 BigQuery costs are increasing.
- What you can do about it.
First off, you should be exporting your data to BigQuery.
It’s too valuable not to.
If you want to read more about why you should check out this blog.
We assume you are and that’s why you're here, but if you’re worrying about costs beforehand go read this first.
What are the costs of storing your GA4 BigQuery data?
- The actual data storage.
The storage is cheap, but it can rack up if you’re a bigger site.
For a smaller site with 2000/3000 visitors a month costs are ~$0.03 a month. And the first $6.25 every month is free!
As you collect more data over time, the storage costs will increase.
- Querying your data.
You can query your data either directly on BigQuery or by using a data visualisation tool like Looker Studio.
The larger the date range, the larger your queries will be.
Why costs increase as your grow
There are two reasons: more data saved & more data used:
More data saved:
- You’ve run GA4 for a long time. The longer you run it the more events you have.
- You create a lot of new events. More events means more data.
More data used:
- You have more people using the data.
- You have people asking queries that need all time values e.g. total revenue per user (all time)
- You have set-up your tables badly.
How can I reduce my BigQuery spend?
There are several levers you can pull:
1. Create reporting tables
Instead of consistently querying the raw BigQuery data, you can create purpose built reporting tables. (In DBT, we’d call these marts.)
These tables are smaller, easier to use tables that are focused around specific things i.e:
- Sessions
- Users
- Pageviews
These tables are:
- Much smaller tables and can massively reduce your data costs..
- Easily reusable across different teams so you still have one source of truth.
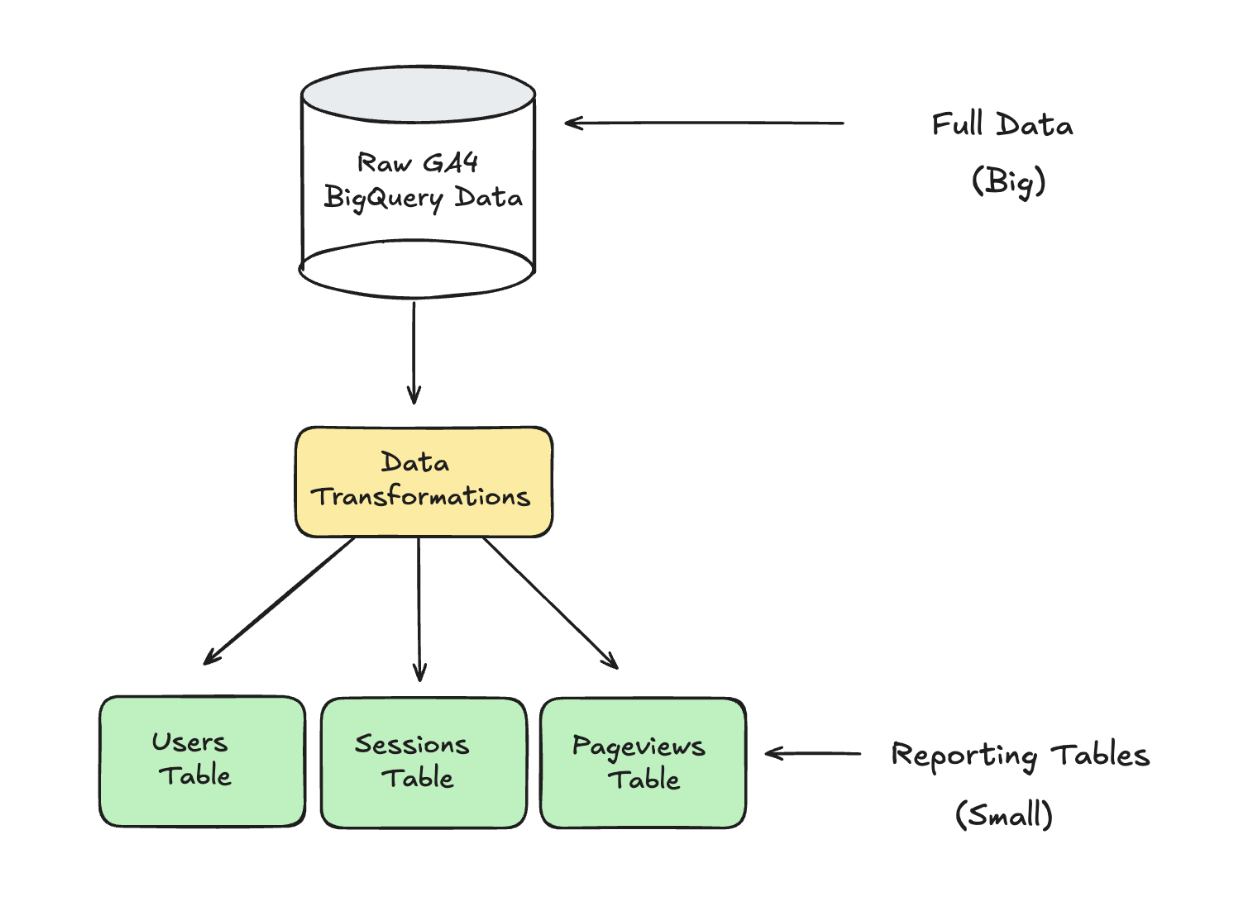
In BigQuery, you can do this using scheduled queries.
For example, you could build a sessions table every week which reports can build off to avoid having to re-query your raw BigQuery data.
As this gets more complex (or bigger) over time, you should start thinking about building a pipeline for your data.
2. Building intermediate tables
Some metrics require looking back at historical data, particularly ones that hit all users i.e.
- Total revenue per user
- Total sessions per user
- First conversion date
Instead of recalculating these metrics by querying your whole GA4 data, you can build an intermediate table that contains just these values.
This intermediate table can then be queried over all time and massively reduce how much data it takes to build these values.
3. Partition by date
BigQuery bills you based on all the data you select.
If you filter on a value this doesn't reduce your cost, unless it's partitioned by that value. In the backend, what this does is classify these as separate tables.
By partitioning by date, and then filtering on specific dates in your queries, you ensure that BigQuery only scans the specific days you care about.
This means that you’re not spending money running scanning all partitions.
4. Clustering by dimensions
Clustering is similar to partitioning.
Instead of splitting by date, you chose the column that BigQuery uses to organise the data within each partition i.e. Country, Device etc.
This reduces query costs as BigQuery can skip over large sections of data that don’t match the filter in the clustering.
Example: If this dataset was clustered on country, then this query would only scan where the country is “United Kingdom”
SELECT
event_name,
COUNT(*) AS event_count
FROM `analytics.events`
WHERE event_date BETWEEN '20250101' AND '20250131'
  AND  country = 'United Kingdom'
GROUP BY event_name
5. Pipeline your data
This means that you don’t need to run ad-hoc queries across the whole dataset.
You can incrementally build your GA4 data, transform it and then either query that directly or work in a visualisation platform like Looker, for example.
At Piped Out, we’ve built pipelines for GA4 data broken down into:
- ** Base events ** - Unflattening the raw GA4 data.
Built off that we have.
- ** Sessions ** - One row per session
- ** Users ** - One row per user
- ** Page Views ** - One row per pageview
This brings down the costs of querying your BigQuery costs down a lot. We've helped teams reduce costs by 100 - 300x through this.
If you can’t be bothered with that
Our Pipeline GA4 product converts your raw GA4 data into data that's ready for analysis and reporting and doesn’t require an engineer to setup.
We already do all the complex saving we’ve talked about above, our queries are optimised to reduce BigQuery costs by up to 300x compared to writing ad hoc queries, and you can do far more personalisation with access to a load of ready to use reports.
Interested?
Schedule a call or get started with the free trial.