Cross Filtering in Looker Studio. It's incredible.
Let’s talk about cross filtering. It is the single most useful feature of Looker (Data) Studio.
(Well pretty much any BI tool, same principles apply to Power BI for example, we're just using Looker for an example).
If you're not using in almost every report, here's your immediate takeaway:
"You should be using cross filtering in almost every report"
That's what this post is going to try and convince you.
Where might we use cross filtering?
Here are the kinds of scenarios where cross filtering helps:
- You have top level changes in a metric, but want to dig down into why it happened.
- i.e. My website traffic is down. From where?
- You have too many dimensions to display on one chart or table.
- i.e. We operate in 26 different territories and I want them all on a chart.
- Your report tables overwhelming and large.
- i.e. I want to segment my website traffic by country, device, medium and see percentage changes for each one.
- You need to cross reference two different datasets.
- i.e. I want to find examples of keyword cannibalisation and then dig into the causes.
We’ve made a lot of reports and they’ve all been better for cross filtering.
It's one of the huge leg ups that a BI tool has on a spreadsheet.
What is cross filtering?
Cross filtering is where you click on one segment of a chart/table and other charts and tables filter to just include that segment.
A video is worth a thousand words:
How does it work?
Clicking segments to cross filter other charts/tables will work if:
- Using the same connector
- The fields are the same (same type & name).
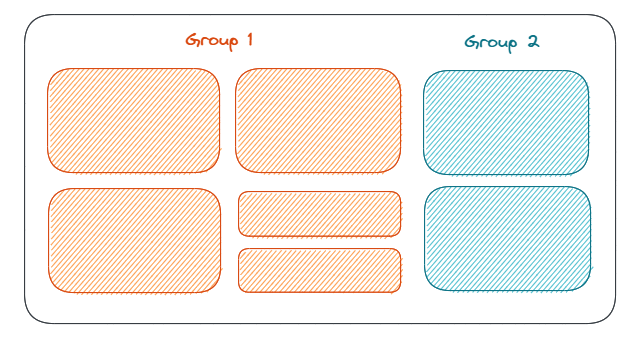
If you have grouped elements, the filtering will just apply to other elements in the group. I.e. in the example below clicking any segment in group 1 will only apply to other segments in group 1.
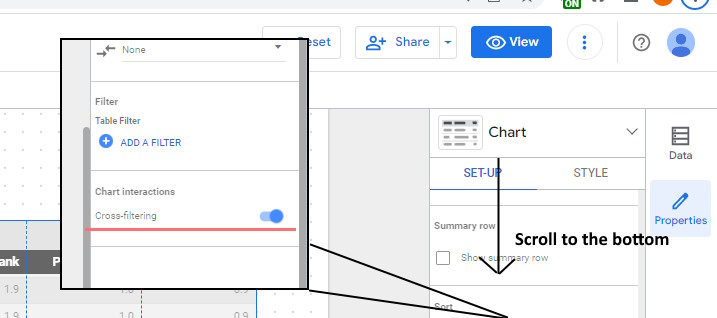
And you can toggle it on and off in the settings here.
That’s the boring basics out of the way. Now how should you use it?
If you'd like working examples of this to play around with all of our free SEO Looker studio templates make heavy use of cross filtering and you can find them in our resource library.
How should you use cross filtering?
Scenario 1 - How has my traffic changed?
Suppose our traffic has changed - up or down.
We want to know why that change happened and to do that we need to see which segments changed.
- Was it just UK traffic?
- Was it direct traffic which changed?
- Did it happen across the entire site or just a segment?
Without cross filtering we’d have to show each one individually, i.e. we could see the change in GB traffic, but not how GB traffic changed for our blog posts.
With cross filtering we can make each segment it’s own table and even pair it with a graph so we can see the change over time.
Clicking any of the tables refocuses the other tables to just that segment.
Showing numbers in the context of totals
A small bit of minor data munging also really helps here, in the example you’ve just seen we’ve forced the percentage change shown to be the percentage of the total.
i.e. If traffic has dropped by 13% then all the percentages will add up to 13.
This prevents a tiny page segment from accidentally dominating in percentage change.
Scenario 2 - Bucketing site visibility
We want to show competitors by visibility and we want to show them all on one graph.
Unfortunately we have more than 4 and it turns out when you have more than 4-5 lines on a chart it gets so busy it’s hard to convey anything.
Even more frustrating 3 competitors have notably larger visibility.
Our niche competitors are still relevant for small volume high value terms, but performance against them is getting lost here.
What can we do?
Now in this example we could show them on two different graphs, but if we end up adding more dimensions and segmenting further this could easily get very busy.
Particularly if we have a lot of other information we want to show alongside the graphs, scorecards and that sort of thing you very quickly end up with busy cluttered dashboard that is hard to read.
Instead cross filtering can jump in:
- We group our dimensions together. High, medium & low volume.
- We show the top level grouping in one set of charts and then show all of them in a second chart.
- When you click on the first chart, the second filters leaving it legible and ready to use.
Cross filtering to the rescue.
Scenario 3 - Keyword cannibalisation
We’re looking into keyword cannibalisation.
We want to find examples where the primary ranking URL is changing. This has two big challenges:
- We want a list of prioritised keywords.
- We want to examine the URLs which are switching places over time.
With cross filtering we can select a keyword in the first example and it will immediately filter the graph to show URLs switching place over time.
Go out and build better dashboards
To leave you on one final note.
Part of the reason cross filtering is so important is that, categorisation/segmentation is super important.
The bigger a website gets the harder it is to just pull patterns from random lists of pages. Categories/segments let you dig in and examine changes and they really benefit from cross filtering.
If you're finding cross filtering isn't so useful, it might also be because you'd benefit from having more categories/segments.
Let us know the most interesting things you’ve managed with it!