Free Search Console Looker Studio Template + Setup Guide
The Search Console interface is ok, but pretty quickly you can find yourself wanting more.
- You can't get more than 1000 rows.
- You constantly have to click between two different tabs to see pages and queries.
- You can't breakdown by dimensions over time (e.g. see country clicks over time)
- You can't add on addition segments (e.g. category vs product).
- You can't breakdown average rank.
- You can't highlight to make the data more useful.
You get the idea.
It's great for getting started and frustrating soon after. The next step in getting more from it is Looker Studio. We've got a free template that will get you going and is personalisable.
Have a play with it and if you're a fan you can find the setup instructions in our resource library.
You can find all of our free seo looker studio templates here.
We just released version 1.1 of our Search Console report. Plenty of small improvements and quality of life changes.
What can it do? Let's take a look.
What can you do with our template?
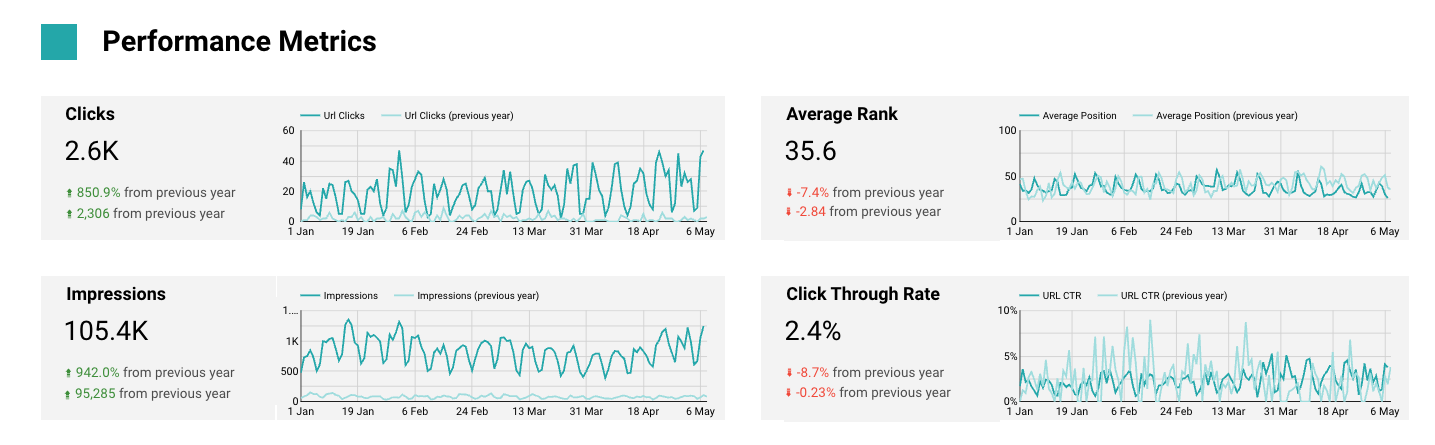
Quickly find winners and losers
Quickly see where you're gaining and losing ranks.
We’ve pulled the two most important fields (clicks and ranks) upfront:
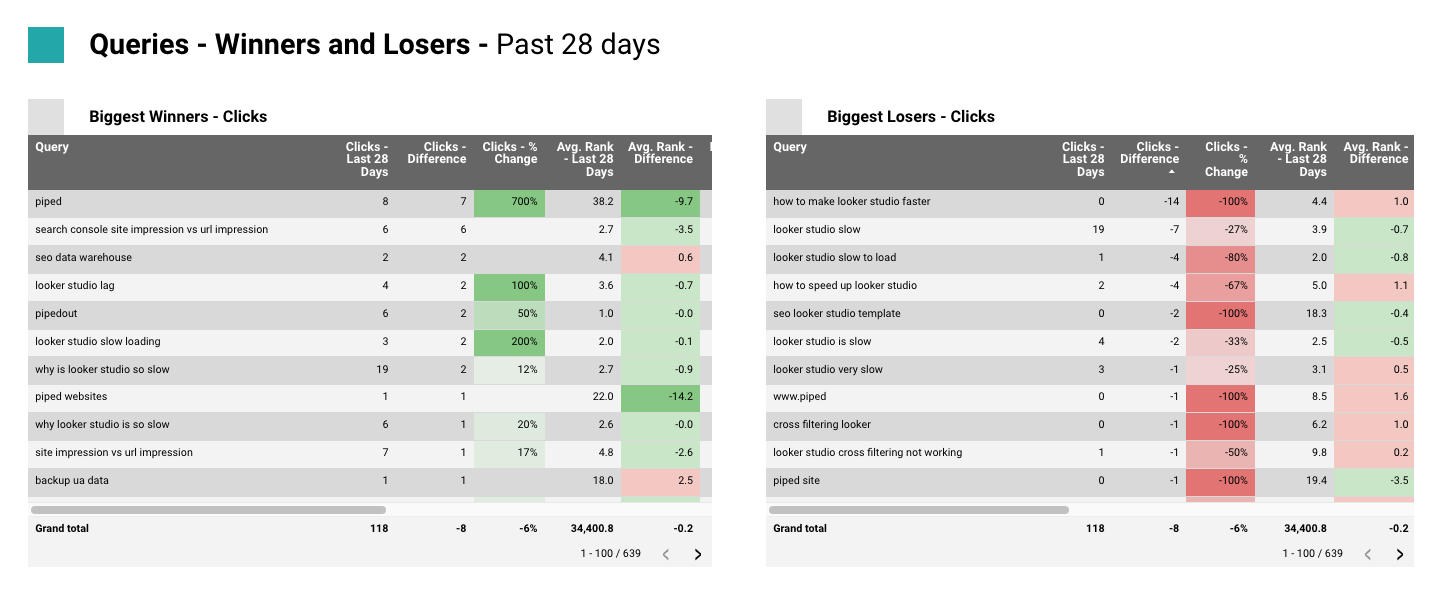
To help you easily spot what's happening we've highlighted it all and in order to make sure the highlighting is correct, we haven't just used heatmaps (because then the highlighting only works in one direction.)
Get more insight into average rank
Average rank is great, but it can easily mislead you.
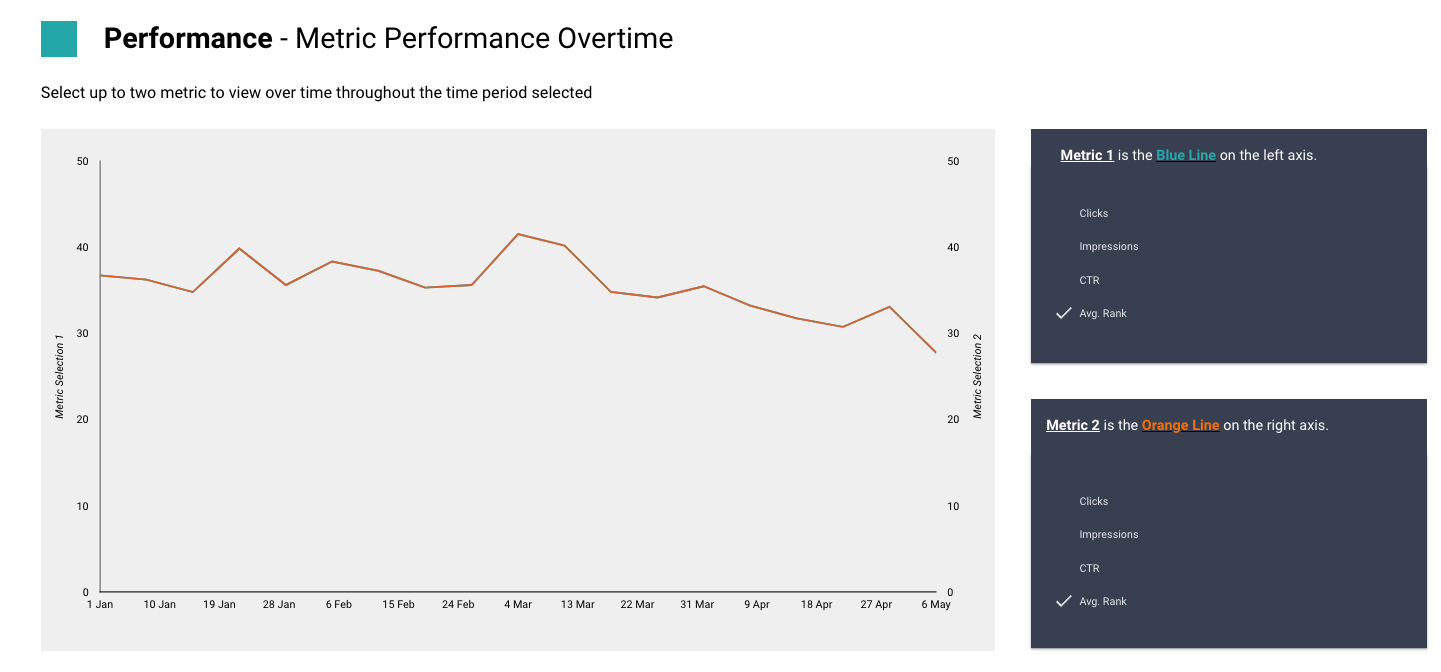
Has our average ranking dropped because we rank worse? Or did we start ranking for keywords in more positions?
We allow you to look at a bucketed count of keywords in different positions to better understand how positions are moving under average rank.
![]()
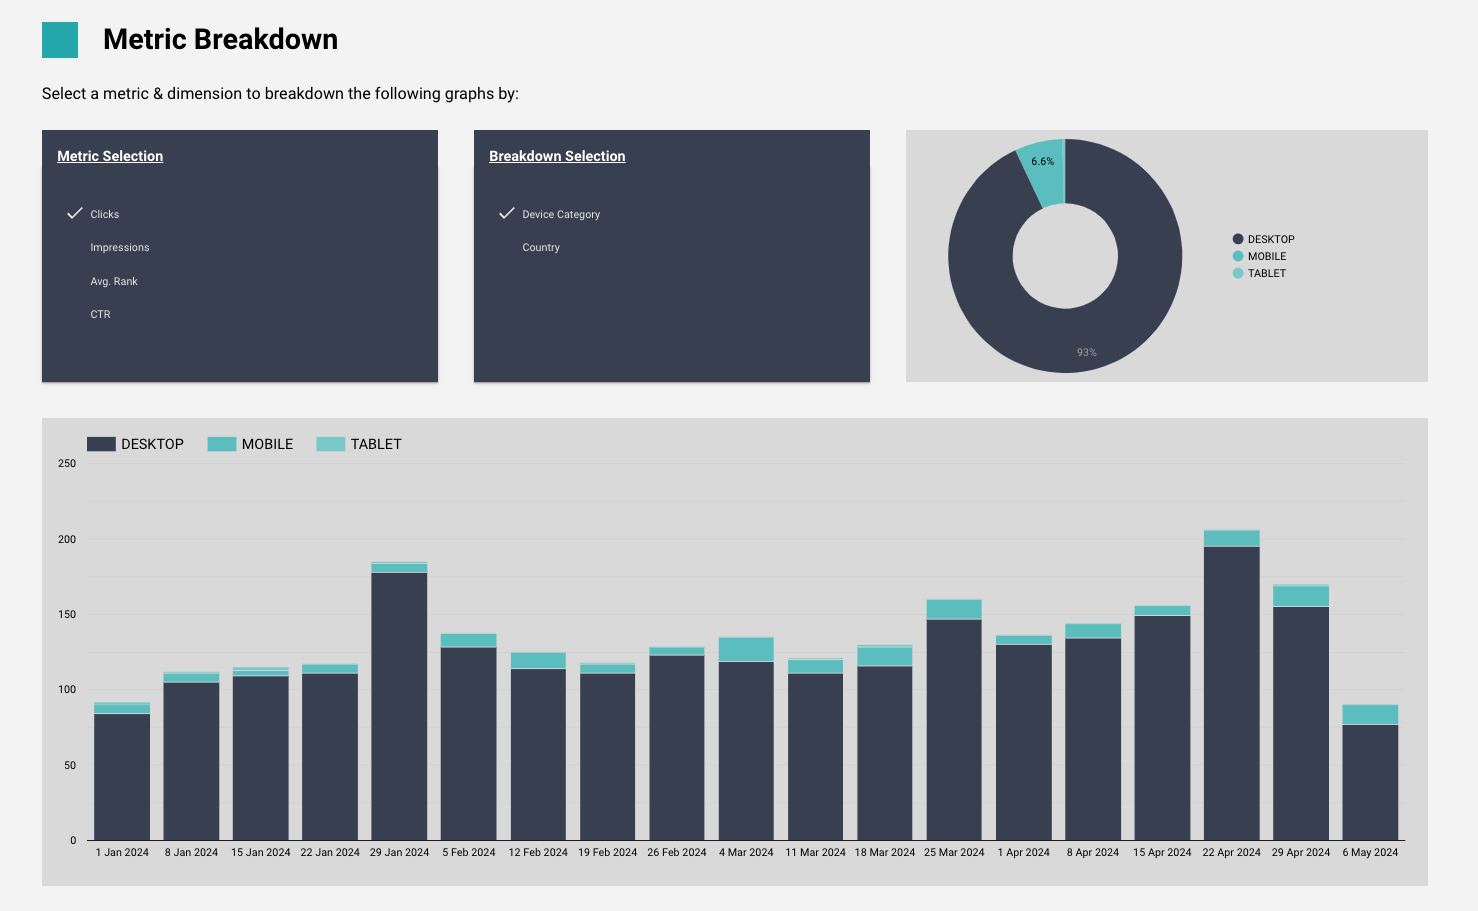
Breakdown dimensions over time
How has your traffic make-up changed over time? Does US consistently drive the same amount of traffic? Has our % of mobile traffic dropped over time?
We let you breakdown your traffic by the different segments.
Plot multiple pages/queries on a graph
Sometimes you want to see multiple pages and queries on one graph, to compare changes went and compare across pages.
We've got a section specifically for that.
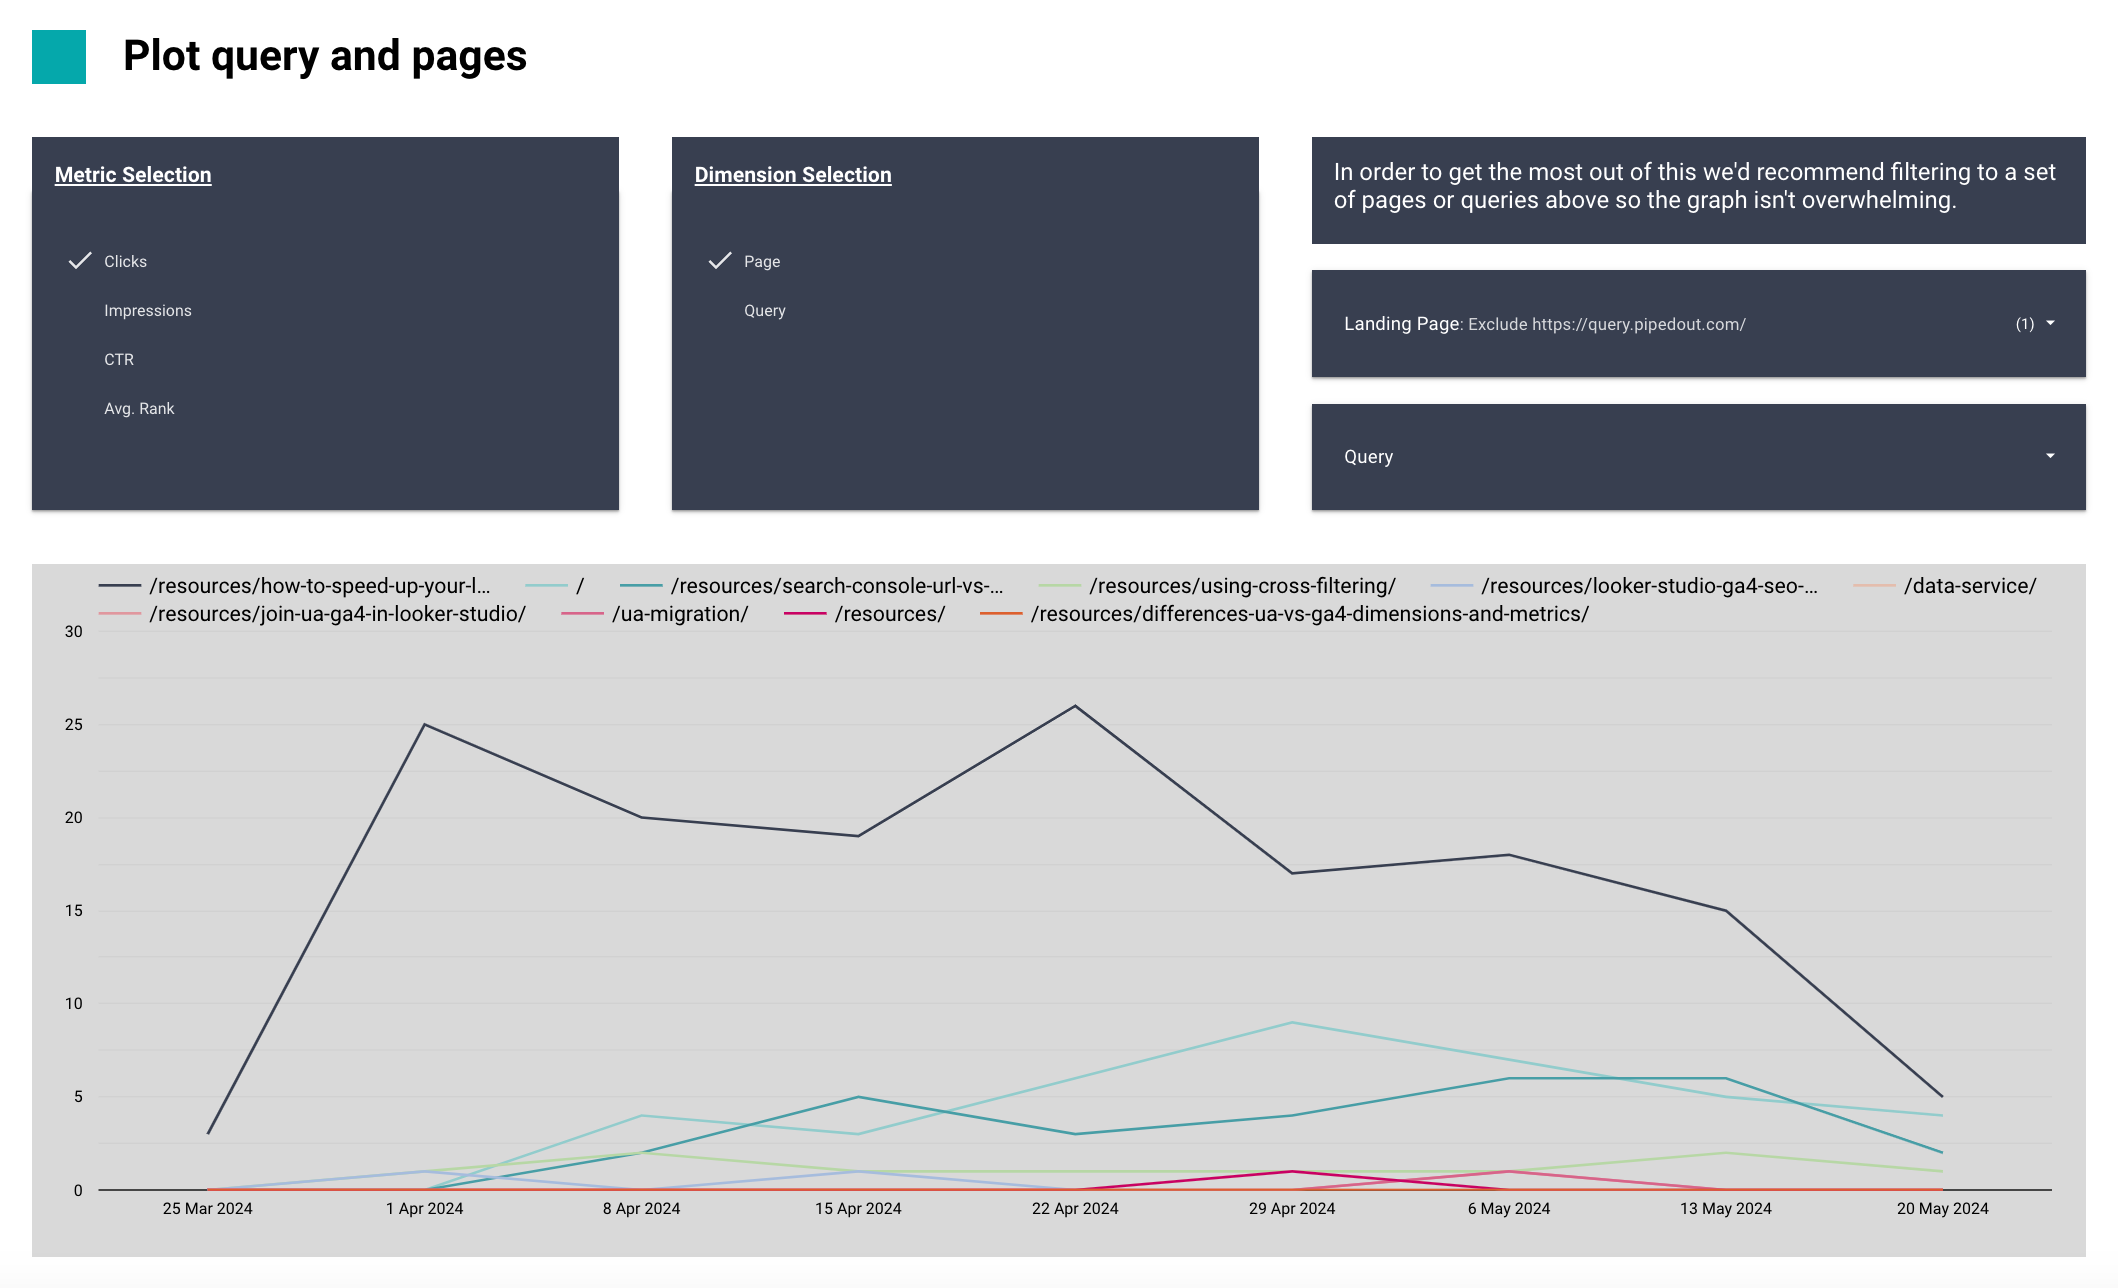
One big caveat to note here however is that the clicks you see in the drop down filter won't match the clicks you see on the graph.
This is because of search console sampling in the native connector.
We'll talk more about this in limitations.
Are we performing better or worse?
If you're a more mature site then this question is best done year on year (because you'll no longer be seeing the hockey stick growth and seasonality becomes a big chunk.)
We've got an entire page for YoY comparison to help you better understand your performance whether you're doing better/worse.
Do you still want more from your dashboards?
Hopefully this dashboard will give you a good starting place for building out reports.
But because it's built on the default connector there are definitely some issues.
You might've noticed how the clicks don't always add up in every place. Certain numbers are basically impossible to get (e.g. counting all the pages which rank in position 5-10.), you only get 16 months data.
This list goes on.
What can you do with a data warehouse?
To show some of what's possible with a data warehouse here we made a copy of the free dashboard, but now with a data warehouse behind it.
- Consistent numbers across all charts
- Revenue/conversions
- More than 16 months data
- More advanced segments like "pages which drive 50/80/90% of revenue/traffic"
- Faster dashboard
- 3 - 4 times more SC data.
- Better period comparison control
- Better metrics for examining the data.
And there are plenty other features not shown on this dashboard.
- Resetting content to publish date
- Weighted sorts
- Joining across more data segments like logs, ads etc.
Would you like better reports? (And even better have someone make them for you)
If you're interested in getting more out of your reporting and data please get in touch.
We help SEO and marketing teams get more out of their data, with data warehouses and better analysis.