How to join GA4 and Search Console data
It’s another practical post.
We’re going to talk through how you can blend Google Analytics 4 (GA4) and Search Console (GSC) data and what to watch out for.
You're probably trying to do one of two things.
1. Get GA4 and GSC on the same graph
We're got a Looker Studio template foundation with the blend built out, so you can use to build reports off.
2. Get revenue/Converions per keyword
But we also know that what most people want from joining is the step above that. Getting revenue/conversions/sessions per query.
This isn't possible in just Looker Studio so you can use our foundation dashboard alongside a small Streamlit app we've built to do one-off analysis with revenue/conversions per keyword.
To have this easily built into reporting, ready for repeat analysis and the greatest possible accuracy though you’re going to want to do this with a data warehouse.
We're not talking about the GA4 Search Console Link
Linking your GA4 profile to GSC (the admin setting) can absolutely be valuable, but it doesn't actually join or blend them together in any meaningful way.
It lets you see your GSC data in GA4 and we want a lot more than that. So let's talk about how to get this going!
Are you a video person?
If so we've got a video version of this post you can watch here.
Why do it?
A couple big reasons:
- Business cases: Businesses run on money not traffic. Being able to put revenue/conversions to keywords helps you build business cases more easily.
- Valuing keywords: It provides a way of valuing how important a keyword is so you can decide where to put your time.
- Extra segmentation: Now you can roughly segment your revenue by keyword groups.
We also get some smaller benefits:
- All in one place: Being able to look at changes in rank/impressions alongside changes in conversions/revenue/sessions.
- Backup analytics source: Joining your GSC with GA4 means if traffic suddenly drops, you can check if it happens only in GA4 in which case someone has broken your analytics.
There’s a couple more, but hopefully that’s enough to get you excited!
Glossary Notes
You might see people using a handful of different words to describe this process.
- Blend
- Join
- Merge
Don’t worry. They all mean exactly the same thing.
We’ll mostly use join in this post, although for shameless SEO purposes we’ll probably sprinkle in blend… (thanks Looker Studio).
How will this work?
To blend Google Analytics and Search Console we're going to:
- Find out shared pieces of information between GSC and GA4
- Get our data from Search Console and GA4
- Join them together based on those pieces of information
- Use ratios to estimate traffic per keyword.
That's our top level conceptual overview.
1. Finding shared pieces of information
What information do both GSC and GA4 (and UA) have in common?
- Country
- Device
- Page
- Date
We’re going to use every shared piece of information because the more we use the more accurate our estimation will be.
2. Get our data from GA4 and Search Console
GA4
We need to get a table with:
- country
- device
- page
- date
- sessions
- conversions
At Piped Out we’ll usually use a combo of API + BQ export, but we’ve got a Looker Studio config below, if that’s technically past you!
GSC
We need to get a table with:
- country
- device
- page
- date
- query
- clicks
- impressions
Again same as above, we’ll typically do this with the API/BQ export, but our example has Looker Studio if that’s scary!
Following along
Ok so if you're following along in python/SQL get your tables then continue.
If you want to do this in Looker Studio you can either:
- Make a dashboard and add in both those data sources (GA4 + GSC)
- Make a copy of the template we made in the resource library and connect your own sources.
3. Join our pieces of data together
Now we need to join our data together. Suppose we have these two datasets. We want to line them up based on our dimensions.
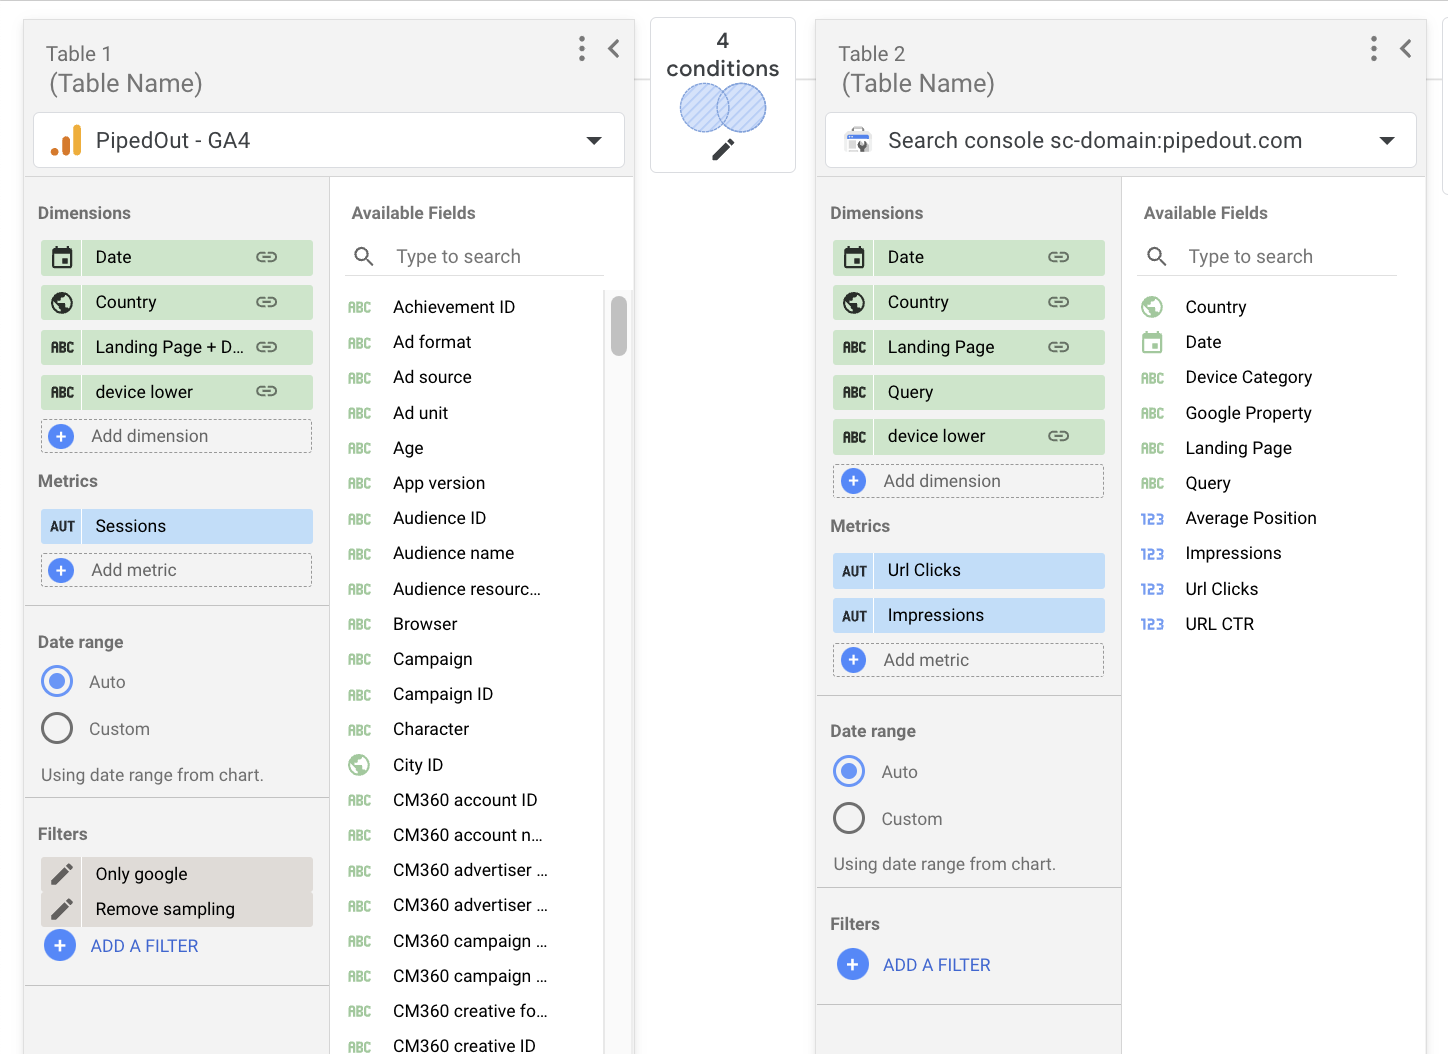
Looker Studio calls this blending and it would look like this
In SQL we’d call it joining and functionally doing this:
FULL OUTER JOIN
	search_console.country = ga4.country AND
	search_console.device = ga4.device AND
	search_console.page = ga4.page AND
	search_console.date = ga4.date
Aligning dimensions
In order to join two data sources together the values need to align.
GA4 and SC annoyingly have mild differences between these columns that we need to fix.
- URL:
- Search Console returns entire URLs
- GA4 returns paths for landing pages.
- This means we have to alter the URL in GA4 to make this work.
- Devices:
- Search Console has device categories in full caps
- GA4 has them in lowercase.
- Countries
- This actually just works in Looker Studio.
- If you do this via the API, Search Console returns ISO codes, so you’ll be wanting to use country codes from GA4.
Following along
If you're in python/SQL you're going to need to go ahead and construct the join like above.
If you're in Looker Studio, you want to go ahead and make the blend shown above.
If you're working with our template:
- Scroll down to this table
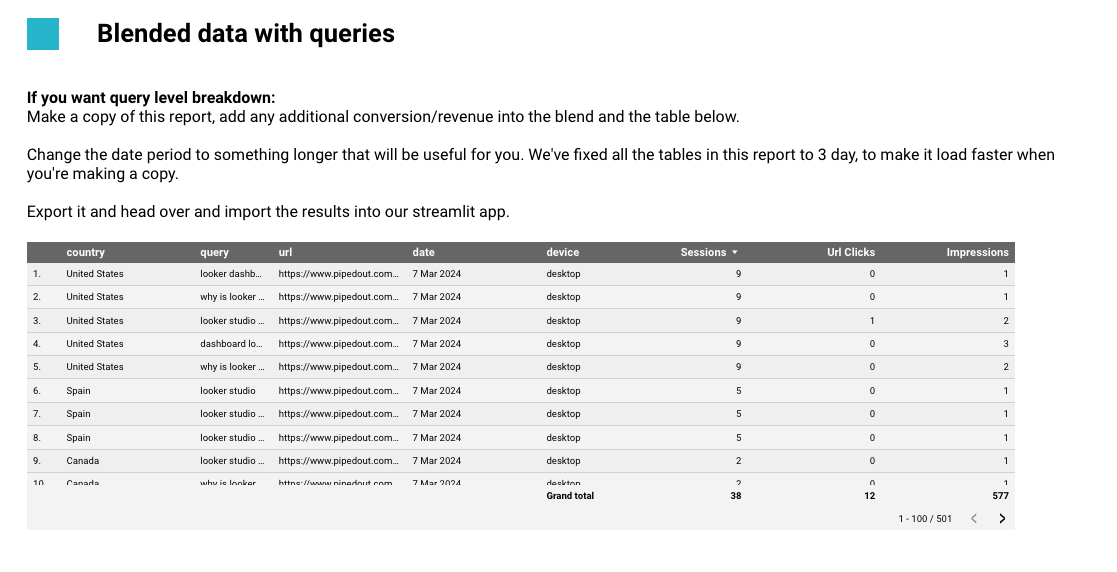
- Edit this report and set the date period on this table to a decent length (e.g. a month or two. We've set it to a single day to get this report to load faster.)
- Pick whatever metrics you want to split by query from GA4 and add them to the blend and this table. We have sessions by default, you probably want revenue/conversions or whatever works for your brand.
If you’re just looking to run this for a one off piece of analysis Looker Studio should work fine.
If you want to do this repeatedly, then eventually you're going to want to move to python or build a data pipeline around it so you can avoid the repetitive/fiddly work.
Don’t care about query?
Did you just want a blend to get sessions and rank on the same graph? Well congratz, we’ve done that now.
But assuming you do care about query, it’s time to move onto that problem.
4. Use ratios to estimate the traffic per keyword
Query is missing. How do we solve this problem?
We don’t get query in Google Analytics and haven’t for some time.
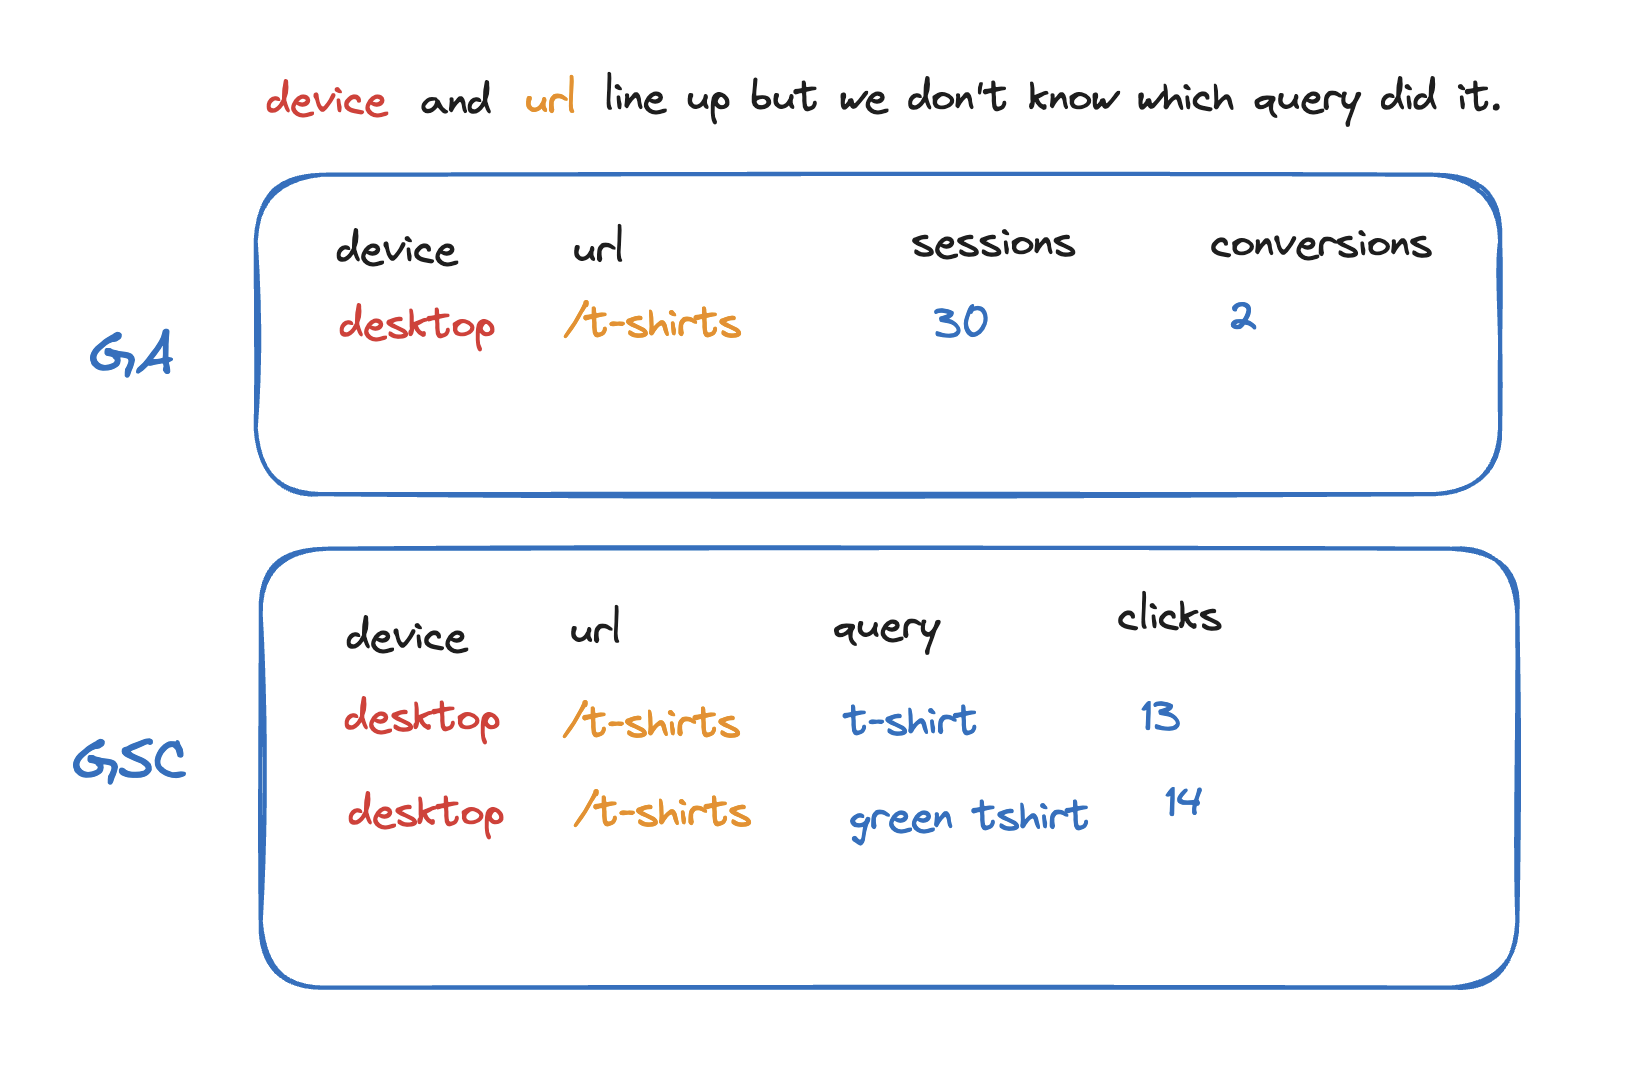
Suppose this is our GSC and GA4 data.
- We have GA traffic to a single URL from desktop
- We have GSC traffic from two queries to that same URL on the desktop
We don’t know how to breakup our single row of GA4 traffic by query. Which query drove the conversion?
While we don’t have query, we do have a couple other dimensions that both SC and GA4 have in common.
- Date
- Device
- Country
- Page
Suppose this was our data:
- We’ve got traffic for a single URL on the desktop from two countries.
- Only one of them has conversions.
- We’ve the got the equivalent GSC data.

Now we can see that the conversion was from “t-shirt” not “green t-shirt”, because only one was searched in the UK.
So if we join with as many dimensions as possible we get our estimate as close to the truth as possible.
Then we generate a ratio for the final step so if we join all our data and find out that 4 queries drove 8 conversions we split like this:
It will never be 100% accurate, but the goal here is just to get more accurate so we can better prioritise, spot important changes etc.
Following along
If you're following along in python/SQL then its some relatively basic maths as described above.
If you're in Looker Studio this isn't possible, you can't do this last step in there.
So for those people we made a Streamlit app which will take the export from Looker Studio and save you having to do the calculations in Excel (which is horrible.)
How to use the Streamlit app
- Create a table of GSC joined with GA4 with the following columns:
- device
- country
- date
- page
- query
- clicks
- impressions
- whatever metrics you’re trying to breakdown by query - sessions, conversions etc.
If you’re using our Looker Studio thats the table we downloaded earlier.
- Upload that table into the Streamlit app and follow the instructions.
- Profit now you’ve got your data ready to go.
Note: This app won’t handle all the tiny edge cases brilliantly e.g. where GA4 says there is 1 session and GSC says there are none, but it’ll work fine for all your main pages and keywords.
Problems
Search console sampling causes us to overestimate the value of keywords
Search Console doesn’t give you all of your queries, it leaves a big chunk missing.
If you have a bigger website this is a problem. Because of the missing queries we will overestimate how many revenue/sessions/conversions each query gets.
If you have a small site this isn’t a problem at all. Hoorah.
How do we check if this is a problem for our site?
This blog post is a little long and we've already described this in another blog post - how to get the maximum possible data from Search Console.
What is this problem?
The sampling is going to break step 4 - ratios and you need to fix it.
Here’s the problem:
- Suppose that we have data for our homepage with the following dimensions.
- homepage:
/ - device:
device - country:
usa - date:
2023-01-10 - conversions:
10
- homepage:
- And we have two keywords which search console shows for that data:
my brand- 30 clicksmy brand shop- 20 clicks
If we don’t account for sampling our answer is:
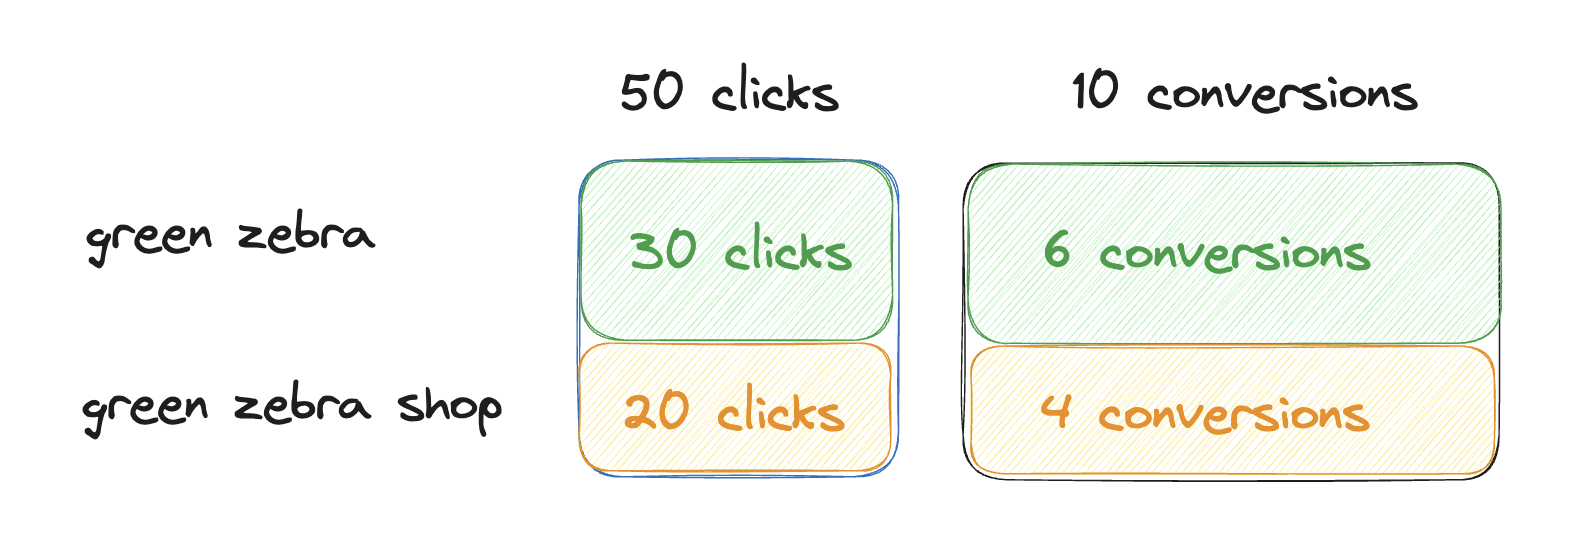
But if we look for sampling
We discover that the page on that day actually it has 100 clicks total, we just didn’t get keywords for 50 clicks.
That means our true ratio should actually be:

How do you fix this?
If you’d like to handle this yourself, you essentially want to:
- Calculate cardinality using the API by getting different combinations of dimensions
- Add it back in as an
(other)row.
Search console assigns traffic to the cardinal page
Suppose someone clicks on /t-shirts?color=green&size=medium and you have then canonicalised to /t-shirts . In Search Console that will show as a click to the canonical un-parametered page.
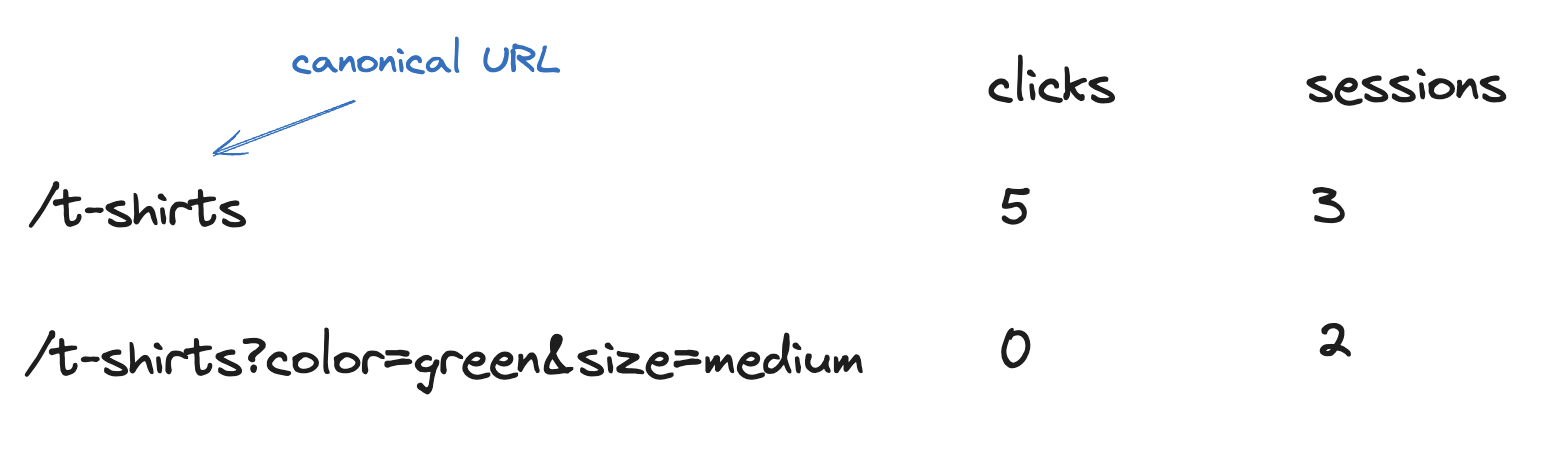
You could attempt to fix for this during the joins, but you then also have to know whether or not Google is respecting the canonical and that’s gonna change.
TL;DR - If you have a tonne of canonical issues this will probably be a little less accurate and it’s very hard/not worth it to fix.
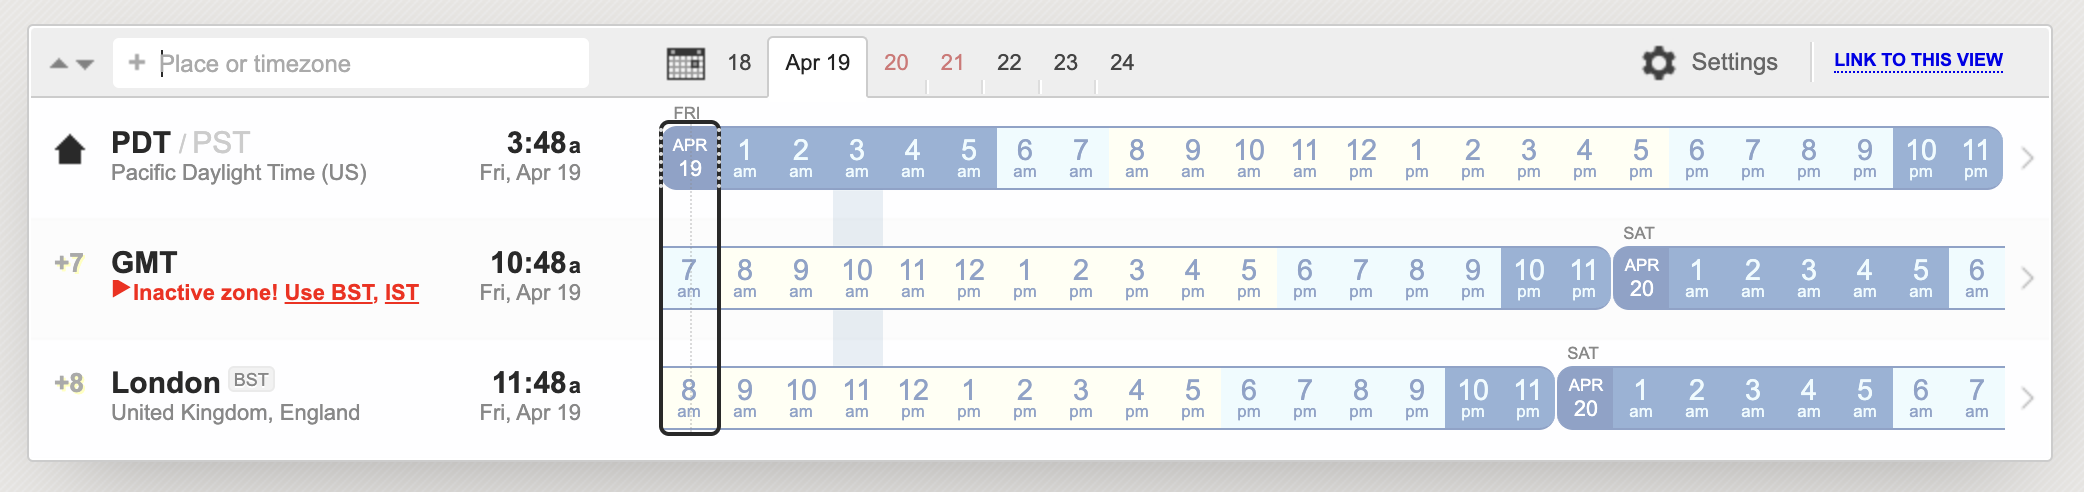
Search Console reports in PDT
Oh no. Timezones.
GA4 reports in whatever timezone you have configured. (In BigQuery you can get event_timestamp for UTC, or event_date for the configured timezone.)
GSC reports in PDT.
Screwing with timezones tends to be pretty fraught, so before we go ahead and alter that we need to check a couple other things.
When does your site traffic happen?
Suppose we’re in the UK. Does most of our sites traffic and business happen between 7/8 and midnight?
Then this is probably less of an issue. Do you happen to based on Australia? Ok perhaps slightly more so.
Do you want to also join with Adwords?
Adwords is also reports in your configured timezone and unlike GA4 it does not make timestamp so accessible on the search query report (where we need it).
If you want to join with Adwords then somewhere we’re going to have timezone problems.
Do you have highly seasonal queries that change day to day?
If your query makeup changes a lot day to day, then fixing timezones can be more valuable, but if you’re in a space where it doesn’t or it’s only the occasional holiday (e.g. Christmas etc.) then probably less so.
What would we typically recommend?
Broadly we typically recommend not altering this. Why?
- With the exception of a couple industries (e.g. news), query type doesn’t hugely enough across individual days.
- Most of our customer base is Europe/US where the timezone difference is less severe.
- Joining with Adwords is a very common use case for our customers and at that point, however you change the timestamp it’s going to be off somewhere.
- Business stakeholders sometimes end up looking at the default SC/GA4 interface at which point it doesn’t match and you can end up doing a lot of justification and explanation to avoid people losing trust in the data.
Fundamentally all of this is an estimation and we’re doing “business not science” to borrow my favourite Will Critchlow phrase. On balance we think not altering is usually the right move.
If however you’re:
- A news business who doesn’t pay for most of their organic keywords.
- Have a notably larger time difference with PDT
Then it may be worthwhile.
Finally remember even at best this is an estimation
A ratio isn’t the truth.
It might be that there is a long tail keyword which drives more conversions even though it has less traffic.
We’re essentially assuming an even breakdown between traffic and conversions when we get down to the level of we’re on the same page, on the same day, from the same device and country. That’s pretty good good. But it’s not the 100% true, it’s just our best estimate.
It’s enough for some useful business analysis, but it’s not gospel.
Fancy a hand?
Want someone to just handle this for you? We’ve already done everything in this post as well as joined it with Adwords, logs and all your other pieces of data.
If you’d like us to get this setup for you please get in touch!